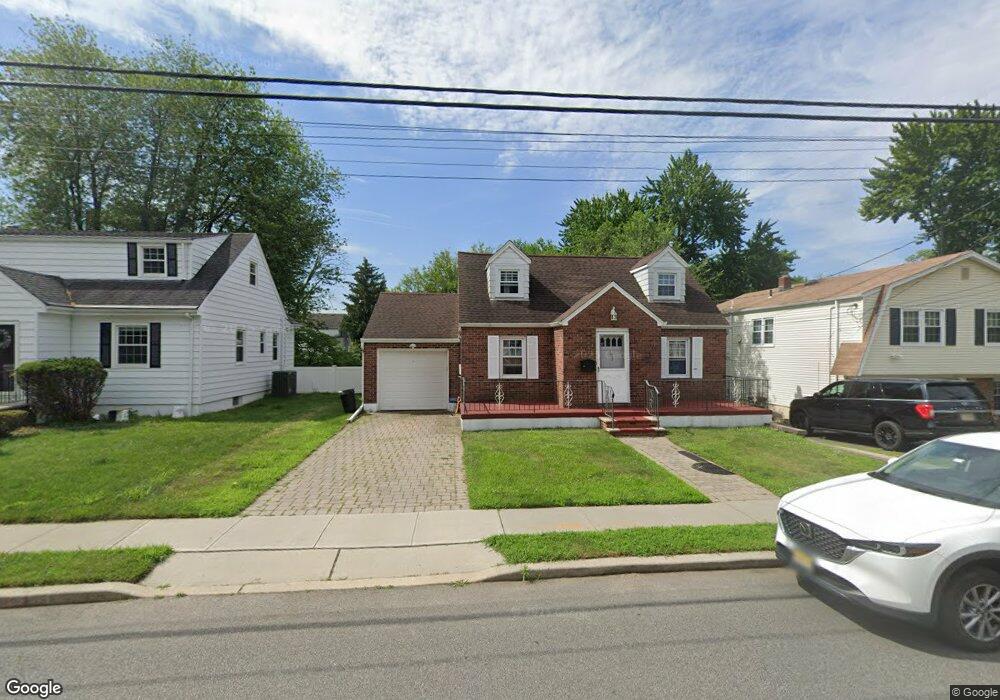
103 Larch Ave Dumont, NJ 07628
Estimated Value: $632,408 - $713,000
--
Bed
--
Bath
1,571
Sq Ft
$433/Sq Ft
Est. Value
About This Home
This home is located at 103 Larch Ave, Dumont, NJ 07628 and is currently estimated at $680,602, approximately $433 per square foot. 103 Larch Ave is a home located in Bergen County with nearby schools including Dumont High School.
Ownership History
Date
Name
Owned For
Owner Type
Purchase Details
Closed on
Nov 22, 1999
Sold by
Montemayor Julian and Montemayor Belen
Bought by
Bukhari Saleem and Bukhari Tahseen
Current Estimated Value
Home Financials for this Owner
Home Financials are based on the most recent Mortgage that was taken out on this home.
Original Mortgage
$161,600
Outstanding Balance
$48,807
Interest Rate
7.61%
Estimated Equity
$631,795
Purchase Details
Closed on
Sep 4, 1996
Sold by
Hynes Declan D and Hynes Julia J
Bought by
Montemayor Judith and Montemayor Julian
Home Financials for this Owner
Home Financials are based on the most recent Mortgage that was taken out on this home.
Original Mortgage
$159,000
Interest Rate
7.89%
Purchase Details
Closed on
Jun 10, 1994
Sold by
Huynh Arthur and Thyyen Su
Bought by
Hynes Declan and Hynes Julia
Home Financials for this Owner
Home Financials are based on the most recent Mortgage that was taken out on this home.
Original Mortgage
$115,000
Interest Rate
8.29%
Create a Home Valuation Report for This Property
The Home Valuation Report is an in-depth analysis detailing your home's value as well as a comparison with similar homes in the area
Home Values in the Area
Average Home Value in this Area
Purchase History
| Date | Buyer | Sale Price | Title Company |
|---|---|---|---|
| Bukhari Saleem | $202,000 | Fidelity National Title Ins | |
| Montemayor Judith | $174,000 | -- | |
| Hynes Declan | $164,000 | -- |
Source: Public Records
Mortgage History
| Date | Status | Borrower | Loan Amount |
|---|---|---|---|
| Open | Bukhari Saleem | $161,600 | |
| Previous Owner | Montemayor Judith | $159,000 | |
| Previous Owner | Hynes Declan | $115,000 |
Source: Public Records
Tax History Compared to Growth
Tax History
| Year | Tax Paid | Tax Assessment Tax Assessment Total Assessment is a certain percentage of the fair market value that is determined by local assessors to be the total taxable value of land and additions on the property. | Land | Improvement |
|---|---|---|---|---|
| 2025 | $10,366 | $541,400 | $315,000 | $226,400 |
| 2024 | $10,111 | $255,000 | $185,000 | $70,000 |
| 2023 | $11,067 | $255,000 | $185,000 | $70,000 |
| 2022 | $11,067 | $285,000 | $185,000 | $100,000 |
| 2021 | $11,012 | $285,000 | $185,000 | $100,000 |
| 2020 | $10,713 | $285,000 | $185,000 | $100,000 |
| 2019 | $10,457 | $285,000 | $185,000 | $100,000 |
| 2018 | $11,278 | $313,800 | $185,000 | $128,800 |
| 2017 | $11,061 | $313,800 | $185,000 | $128,800 |
| 2016 | $10,804 | $313,800 | $185,000 | $128,800 |
| 2015 | $10,556 | $313,800 | $185,000 | $128,800 |
| 2014 | $10,349 | $313,800 | $185,000 | $128,800 |
Source: Public Records
Map
Nearby Homes