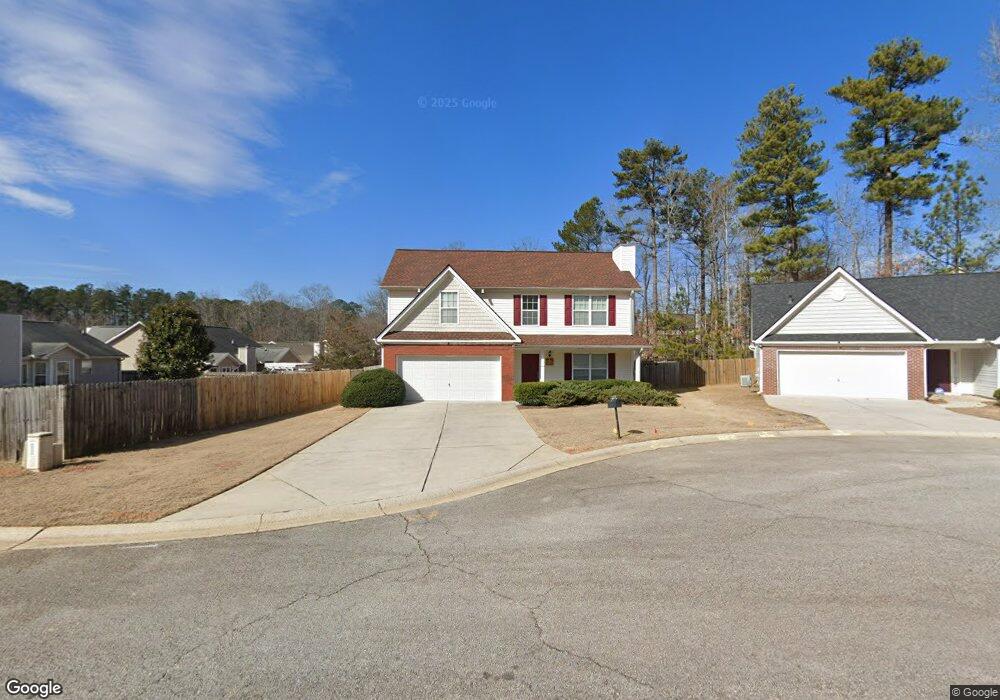
103 Larkin Way Unit 23 Dallas, GA 30157
Estimated Value: $318,000 - $332,000
4
Beds
3
Baths
1,900
Sq Ft
$169/Sq Ft
Est. Value
About This Home
This home is located at 103 Larkin Way Unit 23, Dallas, GA 30157 and is currently estimated at $321,888, approximately $169 per square foot. 103 Larkin Way Unit 23 is a home located in Paulding County with nearby schools including Allgood Elementary School, Herschel Jones Middle School, and Paulding County High School.
Ownership History
Date
Name
Owned For
Owner Type
Purchase Details
Closed on
Sep 24, 2020
Sold by
Thomas Jason
Bought by
Pinto Shellaine P
Current Estimated Value
Home Financials for this Owner
Home Financials are based on the most recent Mortgage that was taken out on this home.
Original Mortgage
$203,300
Outstanding Balance
$180,825
Interest Rate
2.9%
Mortgage Type
New Conventional
Estimated Equity
$141,064
Purchase Details
Closed on
Aug 18, 2005
Sold by
Kdc Ents Llc
Bought by
Thomas Jason
Home Financials for this Owner
Home Financials are based on the most recent Mortgage that was taken out on this home.
Original Mortgage
$30,300
Interest Rate
5.57%
Mortgage Type
New Conventional
Create a Home Valuation Report for This Property
The Home Valuation Report is an in-depth analysis detailing your home's value as well as a comparison with similar homes in the area
Home Values in the Area
Average Home Value in this Area
Purchase History
| Date | Buyer | Sale Price | Title Company |
|---|---|---|---|
| Pinto Shellaine P | $214,000 | -- | |
| Thomas Jason | $151,500 | -- |
Source: Public Records
Mortgage History
| Date | Status | Borrower | Loan Amount |
|---|---|---|---|
| Open | Pinto Shellaine P | $203,300 | |
| Previous Owner | Thomas Jason | $30,300 | |
| Previous Owner | Thomas Jason | $121,200 |
Source: Public Records
Tax History Compared to Growth
Tax History
| Year | Tax Paid | Tax Assessment Tax Assessment Total Assessment is a certain percentage of the fair market value that is determined by local assessors to be the total taxable value of land and additions on the property. | Land | Improvement |
|---|---|---|---|---|
| 2024 | $4,036 | $131,932 | $12,000 | $119,932 |
| 2023 | $3,558 | $119,840 | $12,000 | $107,840 |
| 2022 | $2,628 | $102,668 | $12,000 | $90,668 |
| 2021 | $2,261 | $79,672 | $10,000 | $69,672 |
| 2020 | $2,504 | $73,932 | $10,000 | $63,932 |
| 2019 | $2,358 | $70,384 | $10,000 | $60,384 |
| 2018 | $1,995 | $68,072 | $8,000 | $60,072 |
| 2017 | $2,086 | $61,720 | $8,000 | $53,720 |
| 2016 | $1,840 | $55,108 | $8,000 | $47,108 |
| 2015 | $1,604 | $53,960 | $8,000 | $45,960 |
| 2014 | $1,311 | $43,376 | $8,000 | $35,376 |
| 2013 | -- | $36,240 | $8,000 | $28,240 |
Source: Public Records
Map
Nearby Homes
- 212 Remington Place Blvd
- 305 Remington Place Blvd
- 120 Remington Place Blvd
- 102 Natalie Ct
- 205 Arbor Creek Dr
- 98 Shawnee Trail
- 98 Shawnee Trail Unit 30
- 518 Oak View Ln
- 520 Oak View Ln
- 512 Oak View Ln
- 510 Oak View Ln
- 508 Oak View Ln
- 412 Oak View Ln
- Darwin Plan at Oakleigh Glen
- Penwell Plan at Oakleigh Glen
- Robie Plan at Oakleigh Glen
- 103 Larkin Way
- 105 Larkin Way Unit 24
- 105 Larkin Way
- 213 Remington Place Blvd
- 215 Remington Place Blvd
- 211 Remington Place Blvd
- 211 Remington Place Blvd
- 0 Larkin Way Unit 8732328
- 0 Larkin Way Unit 8605505
- 0 Larkin Way
- 209 Remington Place Blvd
- 610 Cole Creek Dr
- 122 Spring View Branch
- 107 Larkin Way Unit 107
- 107 Larkin Way
- 124 Spring View Branch
- 124 Spring View Branch
- 106 Larkin Way
- 102 Larkin Way
- 301 Remington Place Blvd