B
Landlord's Agent in 2015
Beverley Boswell
Century 21 Novus Realty
Estimated Value: $314,814 - $385,000
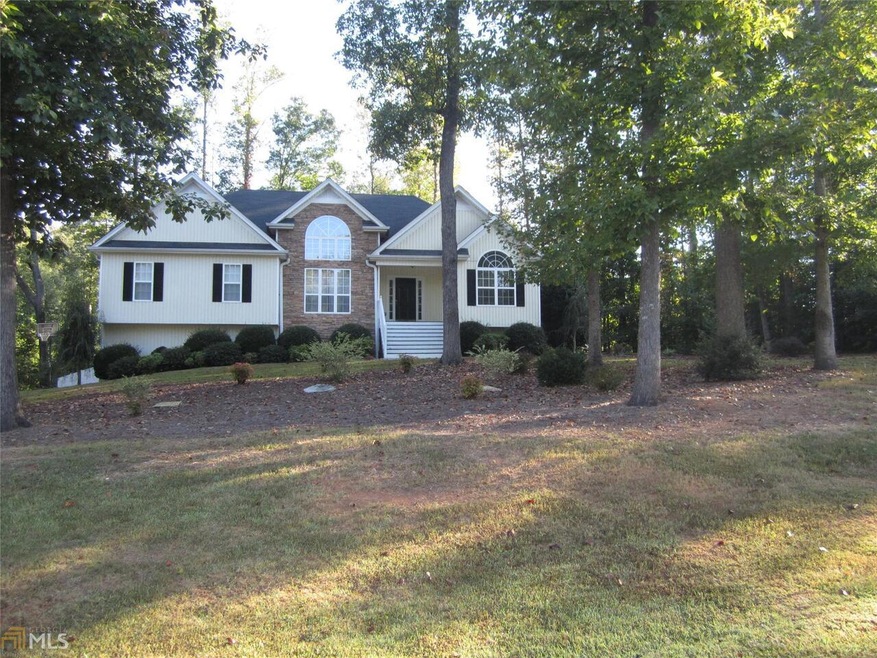
Three bedroom two bath home located in NorthPoint subdivision. Master bedroom on the main level with separate tub and shower. Walk in closet with double vanity. Partial unfinished basement with two car garage.
Last Agent to Rent the Property
Beverley Boswell
Century 21 Novus Realty License #341180 Listed on: 01/07/2015

| Date | Buyer | Sale Price | Title Company |
|---|---|---|---|
| Williamson Anthony D | $164,000 | -- | |
| Sec Of Housing & Urban | -- | -- | |
| Nationstar Mtg Llc | $128,238 | -- | |
| Hendrix Rhonda R | -- | -- | |
| Hendrix Rhonda R | $149,900 | -- | |
| Herrell Sammy | -- | -- |
| Date | Status | Borrower | Loan Amount |
|---|---|---|---|
| Open | Williamson Anthony D | $172,924 |
| Date | Event | Price | List to Sale | Price per Sq Ft |
|---|---|---|---|---|
| 01/07/2015 01/07/15 | Rented | $1,100 | 0.0% | -- |
| 01/07/2015 01/07/15 | For Rent | $1,100 | 0.0% | -- |
| 10/02/2014 10/02/14 | Rented | $1,100 | 0.0% | -- |
| 10/02/2014 10/02/14 | For Rent | $1,100 | -- | -- |
| Year | Tax Paid | Tax Assessment Tax Assessment Total Assessment is a certain percentage of the fair market value that is determined by local assessors to be the total taxable value of land and additions on the property. | Land | Improvement |
|---|---|---|---|---|
| 2024 | $2,779 | $122,823 | $8,424 | $114,399 |
| 2023 | $2,779 | $113,120 | $8,424 | $104,696 |
| 2022 | $2,318 | $92,423 | $8,424 | $83,999 |
| 2021 | $2,058 | $80,286 | $8,424 | $71,862 |
| 2020 | $1,871 | $72,877 | $8,424 | $64,453 |
| 2019 | $1,735 | $67,056 | $8,424 | $58,632 |
| 2018 | $1,563 | $59,522 | $8,424 | $51,098 |
| 2017 | $1,568 | $59,522 | $8,424 | $51,098 |
| 2016 | $1,568 | $59,522 | $8,424 | $51,098 |
| 2015 | $1,475 | $52,750 | $8,424 | $44,326 |
| 2014 | $1,481 | $52,750 | $8,424 | $44,326 |
B
Landlord's Agent in 2015
Beverley Boswell
Century 21 Novus Realty
Tenant's Agent in 2015
Glenda Broker
Non-Mls Company
(800) 289-1214
Source: Georgia MLS
MLS Number: 7383687
APN: 089-0835
Disclaimer: Certain information contained herein is derived from information provided by parties other than Homes.com. All information provided is deemed reliable, but is not guaranteed to be accurate and should be independently verified.
![]() The data relating to real estate for sale on this web site comes in part from the Broker Reciprocity Program of Georgia MLS. Real estate listings held by brokerage firms other than Redfin are marked with the Broker Reciprocity logo and detailed information about them includes the name of the listing brokers. Information deemed reliable but not guaranteed. Copyright 2025 Georgia MLS. All rights reserved.
The data relating to real estate for sale on this web site comes in part from the Broker Reciprocity Program of Georgia MLS. Real estate listings held by brokerage firms other than Redfin are marked with the Broker Reciprocity logo and detailed information about them includes the name of the listing brokers. Information deemed reliable but not guaranteed. Copyright 2025 Georgia MLS. All rights reserved.