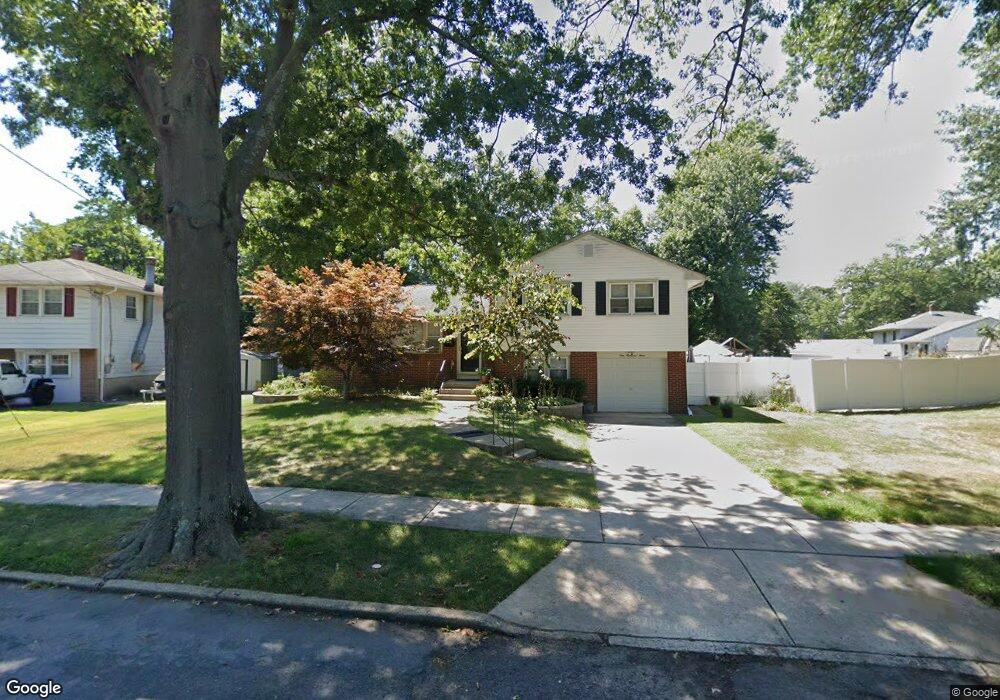
103 Laurelbrook Rd Cherry Hill, NJ 08034
Estimated Value: $405,905 - $448,000
Studio
--
Bath
1,533
Sq Ft
$277/Sq Ft
Est. Value
About This Home
This home is located at 103 Laurelbrook Rd, Cherry Hill, NJ 08034 and is currently estimated at $424,226, approximately $276 per square foot. 103 Laurelbrook Rd is a home located in Camden County with nearby schools including Horace Mann Elementary School, John A Carusi Middle School, and Cherry Hill High-West High School.
Ownership History
Date
Name
Owned For
Owner Type
Purchase Details
Closed on
Apr 15, 2020
Sold by
Ymer Erik and Ymer Janet
Bought by
Ymer Janet
Current Estimated Value
Home Financials for this Owner
Home Financials are based on the most recent Mortgage that was taken out on this home.
Original Mortgage
$176,000
Outstanding Balance
$120,479
Interest Rate
2.7%
Mortgage Type
New Conventional
Estimated Equity
$303,747
Purchase Details
Closed on
Dec 11, 2002
Sold by
Kochilas Lazaros
Bought by
Ymer Erik
Home Financials for this Owner
Home Financials are based on the most recent Mortgage that was taken out on this home.
Original Mortgage
$134,400
Interest Rate
5.99%
Purchase Details
Closed on
Feb 22, 1996
Sold by
Stein Nathan
Bought by
Kochilas Lazaros and Kokali Androniki
Home Financials for this Owner
Home Financials are based on the most recent Mortgage that was taken out on this home.
Original Mortgage
$117,000
Interest Rate
7%
Create a Home Valuation Report for This Property
The Home Valuation Report is an in-depth analysis detailing your home's value as well as a comparison with similar homes in the area
Home Values in the Area
Average Home Value in this Area
Purchase History
| Date | Buyer | Sale Price | Title Company |
|---|---|---|---|
| Ymer Janet | $220,000 | Core Title | |
| Ymer Erik | $168,000 | -- | |
| Kochilas Lazaros | $123,000 | -- |
Source: Public Records
Mortgage History
| Date | Status | Borrower | Loan Amount |
|---|---|---|---|
| Open | Ymer Janet | $176,000 | |
| Previous Owner | Ymer Erik | $134,400 | |
| Previous Owner | Kochilas Lazaros | $117,000 |
Source: Public Records
Tax History
| Year | Tax Paid | Tax Assessment Tax Assessment Total Assessment is a certain percentage of the fair market value that is determined by local assessors to be the total taxable value of land and additions on the property. | Land | Improvement |
|---|---|---|---|---|
| 2025 | $8,194 | $174,300 | $62,700 | $111,600 |
| 2024 | $7,324 | $174,300 | $62,700 | $111,600 |
| 2023 | $7,324 | $174,300 | $62,700 | $111,600 |
| 2022 | $7,122 | $174,300 | $62,700 | $111,600 |
| 2021 | $7,145 | $174,300 | $62,700 | $111,600 |
| 2020 | $7,057 | $174,300 | $62,700 | $111,600 |
| 2019 | $7,054 | $174,300 | $62,700 | $111,600 |
| 2018 | $7,035 | $174,300 | $62,700 | $111,600 |
| 2017 | $6,939 | $174,300 | $62,700 | $111,600 |
| 2016 | $6,847 | $174,300 | $62,700 | $111,600 |
| 2015 | $6,738 | $174,300 | $62,700 | $111,600 |
| 2014 | $6,663 | $174,300 | $62,700 | $111,600 |
Source: Public Records
Map
Nearby Homes
- 132 Oakdale Rd
- 1022 Haral Place
- 308 S Woodstock Dr
- 140 Uxbridge Unit C0140
- 175 Mansfield Blvd N
- 302 Provincetown Rd
- 381 Tavistock
- 412 Tavistock
- 414 Tavistock
- 23 Mcphelin Ave
- 154 Tavistock
- 371 Kresson Rd
- 16 Moore Ave
- 301 Browning Ln Unit 50
- 121 Centura
- 95 Lane of Acres
- 24 Centura
- 401 Spruce St
- 202 Cranford Rd
- 328 Browning Ln
- 105 Laurelbrook Rd
- 115 N Valleybrook Rd
- 117 N Valleybrook Rd
- 107 Laurelbrook Rd
- 106 Sunnybrook Rd
- 111 N Valleybrook Rd
- 104 Laurelbrook Rd
- 102 Laurelbrook Rd
- 110 Sunnybrook Rd
- 100 Sunnybrook Rd
- 112 Sunnybrook Rd
- 109 Laurelbrook Rd
- 110 Laurelbrook Rd
- 109 N Valleybrook Rd
- 114 N Valleybrook Rd
- 116 N Valleybrook Rd
- 116 Sunnybrook Rd
- 112 N Valleybrook Rd
- 111 Laurelbrook Rd
- 118 N Valleybrook Rd
Your Personal Tour Guide
Ask me questions while you tour the home.