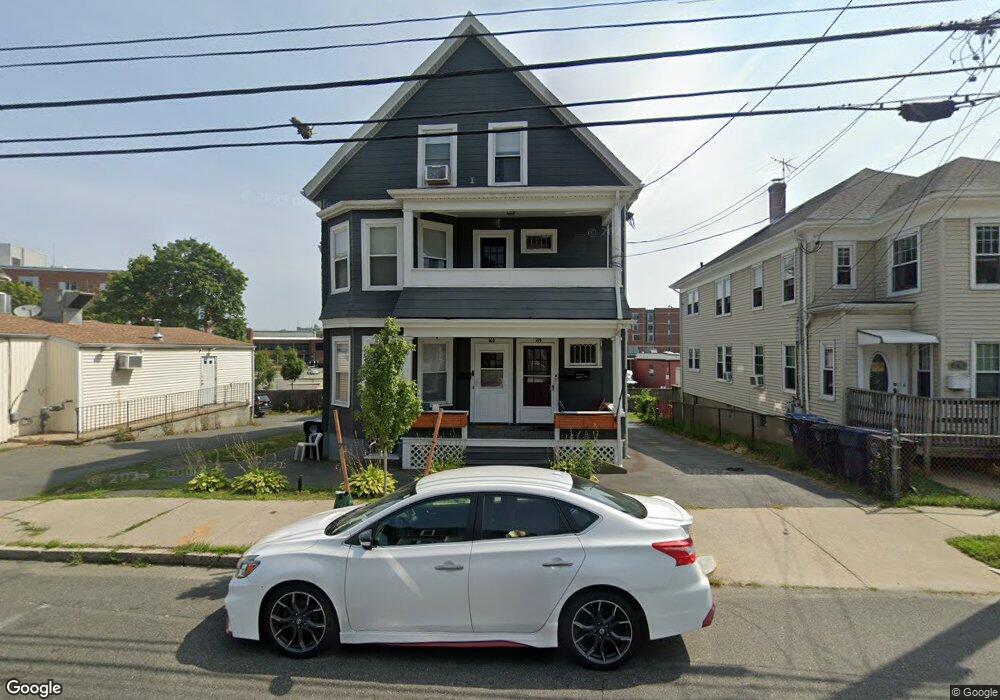
103 Loring Ave Unit 105 Salem, MA 01970
South Salem NeighborhoodEstimated Value: $411,000
6
Beds
3
Baths
2,949
Sq Ft
$139/Sq Ft
Est. Value
About This Home
This home is located at 103 Loring Ave Unit 105, Salem, MA 01970 and is currently priced at $411,000, approximately $139 per square foot. 103 Loring Ave Unit 105 is a home located in Essex County with nearby schools including Saltonstall School, Horace Mann Laboratory, and Witchcraft Heights Elementary School.
Ownership History
Date
Name
Owned For
Owner Type
Purchase Details
Closed on
Nov 10, 2022
Sold by
Page James M
Bought by
Page Jody A and Page Laurel E
Current Estimated Value
Home Financials for this Owner
Home Financials are based on the most recent Mortgage that was taken out on this home.
Original Mortgage
$350,000
Outstanding Balance
$339,087
Interest Rate
6.92%
Mortgage Type
Purchase Money Mortgage
Purchase Details
Closed on
May 31, 2022
Sold by
Page James M
Bought by
Dixon Christina
Home Financials for this Owner
Home Financials are based on the most recent Mortgage that was taken out on this home.
Original Mortgage
$356,155
Interest Rate
5.11%
Mortgage Type
Purchase Money Mortgage
Purchase Details
Closed on
Jan 31, 1996
Sold by
Vasile Avin Vico and Vasile Steven
Bought by
King Dennis A and King Stella
Create a Home Valuation Report for This Property
The Home Valuation Report is an in-depth analysis detailing your home's value as well as a comparison with similar homes in the area
Home Values in the Area
Average Home Value in this Area
Purchase History
| Date | Buyer | Sale Price | Title Company |
|---|---|---|---|
| Page Jody A | $389,000 | None Available | |
| Dixon Christina | $438,000 | None Available | |
| Helm Lauren | $374,900 | None Available | |
| King Dennis A | $147,000 | -- |
Source: Public Records
Mortgage History
| Date | Status | Borrower | Loan Amount |
|---|---|---|---|
| Open | Page Jody A | $350,000 | |
| Previous Owner | Helm Lauren | $356,155 | |
| Previous Owner | Dixon Christina | $344,000 | |
| Previous Owner | King Dennis A | $196,000 | |
| Previous Owner | King Dennis A | $227,000 | |
| Previous Owner | King Dennis A | $205,000 |
Source: Public Records
Tax History
| Year | Tax Paid | Tax Assessment Tax Assessment Total Assessment is a certain percentage of the fair market value that is determined by local assessors to be the total taxable value of land and additions on the property. | Land | Improvement |
|---|---|---|---|---|
| 2022 | $7,351 | $554,800 | $154,800 | $400,000 |
| 2021 | $7,082 | $513,200 | $145,900 | $367,300 |
| 2020 | $6,582 | $455,500 | $131,000 | $324,500 |
| 2019 | $6,153 | $407,500 | $119,100 | $288,400 |
| 2018 | $5,195 | $337,800 | $110,800 | $227,000 |
| 2017 | $5,023 | $316,700 | $104,200 | $212,500 |
| 2016 | $4,656 | $297,100 | $84,600 | $212,500 |
| 2015 | $4,633 | $282,300 | $84,600 | $197,700 |
Source: Public Records
Map
Nearby Homes
- 34 Moffatt Rd
- 106 Broadway Unit 3
- 23 Marion Rd Unit B
- 28 Surrey Rd
- 4 Fairview Rd
- 24 Wisteria St Unit 2
- 326 Lafayette St Unit 2
- 263 Jefferson Ave
- 259 Jefferson Ave
- 6 Arthur St Unit 3
- 29 Willson St
- 29 Ocean Ave Unit 4
- 1 Shore Ave
- 4 Willow Ave Unit 2
- 10 Hazel St Unit 2
- 6R Hazel Terrace Unit 1
- 11 Angenica Terrace
- 13 Roslyn St Unit 2
- 6 Loring Hills Ave Unit D3
- 59 Leach St Unit 2
- 103 Loring Ave Unit 3
- 105 Loring Ave Unit 3
- 103 Loring Ave Unit 1
- 103-105 Loring Ave Unit 1
- 103-105 Loring Ave Unit 2
- 103-105 Loring Ave Unit 3
- 107 Loring Ave
- 101 Loring Ave
- 101 Loring Ave
- 95 Loring Ave
- 111 Loring Ave
- 113 Loring Ave
- 113 Loring Ave Unit 2
- 113 Loring Ave Unit 1
- 91 Loring Ave
- 100 Loring Ave
- 106 Loring Ave
- 96 Loring Ave
- 92 Loring Ave
- 87 Loring Ave
Your Personal Tour Guide
Ask me questions while you tour the home.