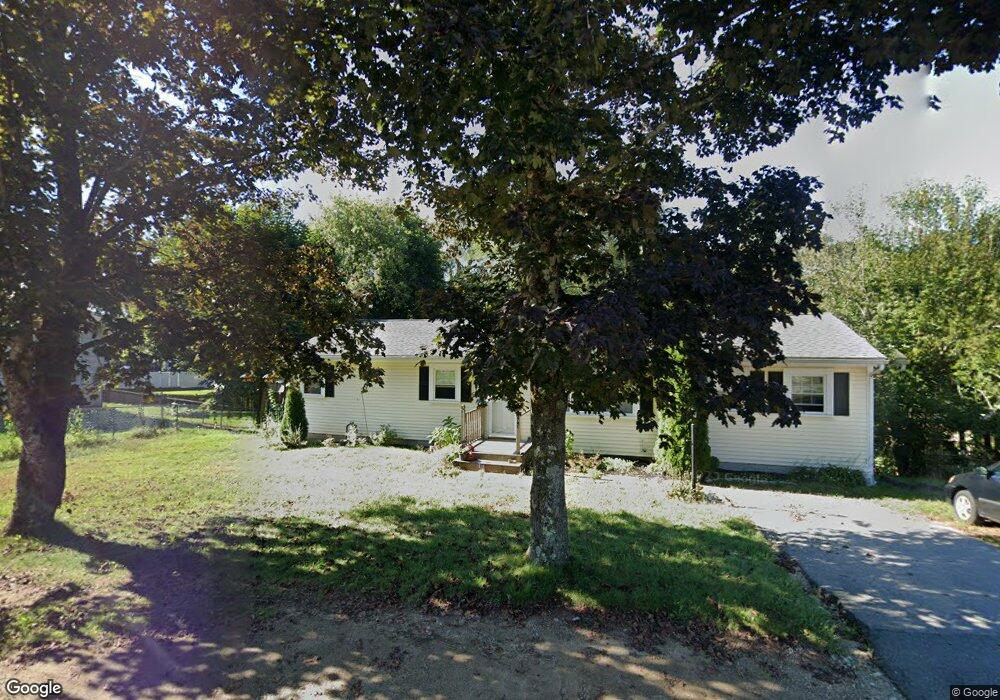
103 Lovering St Medway, MA 02053
Estimated Value: $593,124 - $823,000
3
Beds
2
Baths
1,428
Sq Ft
$474/Sq Ft
Est. Value
About This Home
This home is located at 103 Lovering St, Medway, MA 02053 and is currently estimated at $676,281, approximately $473 per square foot. 103 Lovering St is a home located in Norfolk County with nearby schools including John D. McGovern Elementary School, Burke-Memorial Elementary, and Medway Middle School.
Ownership History
Date
Name
Owned For
Owner Type
Purchase Details
Closed on
May 20, 1988
Sold by
Smith Brian S
Bought by
Egizi Christopher B L
Current Estimated Value
Home Financials for this Owner
Home Financials are based on the most recent Mortgage that was taken out on this home.
Original Mortgage
$120,800
Interest Rate
10.13%
Mortgage Type
Purchase Money Mortgage
Create a Home Valuation Report for This Property
The Home Valuation Report is an in-depth analysis detailing your home's value as well as a comparison with similar homes in the area
Home Values in the Area
Average Home Value in this Area
Purchase History
| Date | Buyer | Sale Price | Title Company |
|---|---|---|---|
| Egizi Christopher B L | $151,000 | -- |
Source: Public Records
Mortgage History
| Date | Status | Borrower | Loan Amount |
|---|---|---|---|
| Open | Egizi Christopher B L | $17,000 | |
| Closed | Egizi Christopher B L | $120,800 | |
| Previous Owner | Egizi Christopher B L | $12,000 |
Source: Public Records
Tax History Compared to Growth
Tax History
| Year | Tax Paid | Tax Assessment Tax Assessment Total Assessment is a certain percentage of the fair market value that is determined by local assessors to be the total taxable value of land and additions on the property. | Land | Improvement |
|---|---|---|---|---|
| 2025 | $6,984 | $490,100 | $261,900 | $228,200 |
| 2024 | $7,057 | $490,100 | $261,900 | $228,200 |
| 2023 | $6,690 | $419,700 | $225,600 | $194,100 |
| 2022 | $6,560 | $387,500 | $201,500 | $186,000 |
| 2021 | $6,139 | $351,600 | $181,300 | $170,300 |
| 2020 | $5,801 | $331,500 | $161,200 | $170,300 |
| 2019 | $5,544 | $326,700 | $161,200 | $165,500 |
| 2018 | $5,570 | $315,400 | $141,000 | $174,400 |
| 2017 | $5,320 | $296,900 | $131,000 | $165,900 |
| 2016 | $5,288 | $292,000 | $126,100 | $165,900 |
| 2015 | $5,215 | $285,900 | $118,900 | $167,000 |
| 2014 | $4,919 | $261,100 | $124,900 | $136,200 |
Source: Public Records
Map
Nearby Homes
- 19 Sycamore Way Unit L40
- 116 Winthrop St
- 36 Lovering St
- 14 Heritage Dr
- 12 Longmeadow Ln
- 12 Lovering St
- 7 Hill St
- 22 Sunset Dr
- 106 Holliston St
- 0 Hill St
- 30 Broken Tree Rd
- 3 Meryl St
- 1 Walnut Ln
- 15 Broad Acres Farm Rd
- 176 Main St Unit 3
- 625 Norfolk St
- 50 Main St
- 28 Wellington St
- 6 Freedom Trail
- 5 Fales St