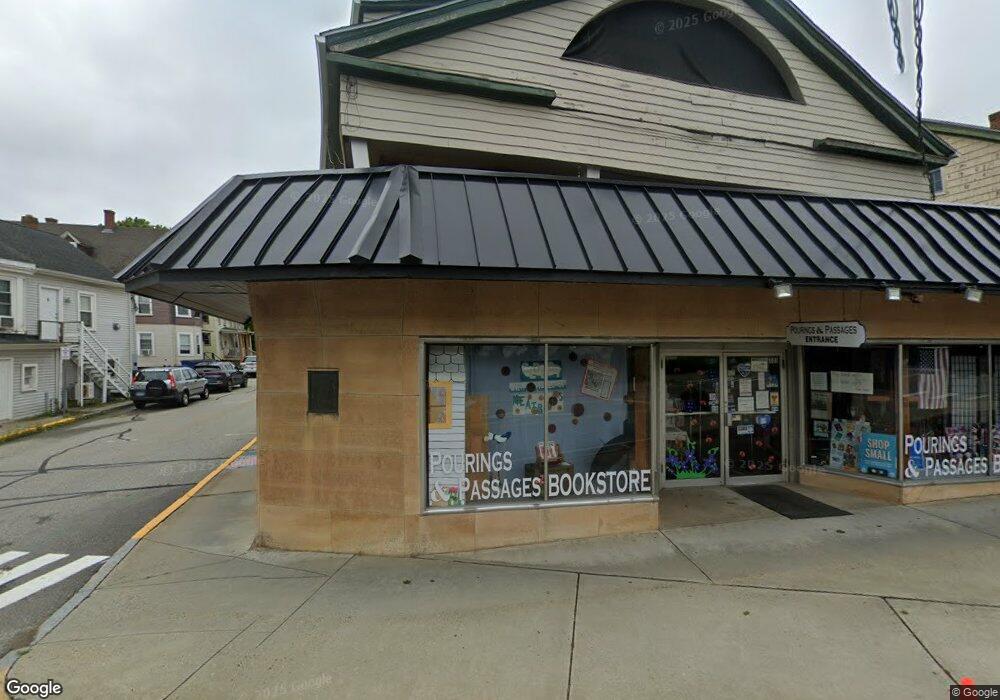
103 Main St Killingly, CT 06239
Estimated Value: $776,429
13
Beds
8
Baths
13,433
Sq Ft
$58/Sq Ft
Est. Value
About This Home
This home is located at 103 Main St, Killingly, CT 06239 and is currently estimated at $776,429, approximately $57 per square foot. 103 Main St is a home located in Windham County with nearby schools including Killingly Central School, Killingly Memorial School, and Killingly Intermediate School.
Ownership History
Date
Name
Owned For
Owner Type
Purchase Details
Closed on
Dec 11, 2023
Sold by
Solomon Troy Investments
Bought by
Svt Properties Llc
Current Estimated Value
Home Financials for this Owner
Home Financials are based on the most recent Mortgage that was taken out on this home.
Original Mortgage
$655,200
Outstanding Balance
$642,793
Interest Rate
7.79%
Mortgage Type
Purchase Money Mortgage
Estimated Equity
$133,636
Purchase Details
Closed on
Oct 27, 2021
Sold by
Sovereign Property Assoc
Bought by
Solomon Troy Inv
Home Financials for this Owner
Home Financials are based on the most recent Mortgage that was taken out on this home.
Original Mortgage
$409,500
Interest Rate
2.8%
Mortgage Type
Purchase Money Mortgage
Create a Home Valuation Report for This Property
The Home Valuation Report is an in-depth analysis detailing your home's value as well as a comparison with similar homes in the area
Home Values in the Area
Average Home Value in this Area
Purchase History
| Date | Buyer | Sale Price | Title Company |
|---|---|---|---|
| Svt Properties Llc | $669,000 | None Available | |
| Svt Properties Llc | $669,000 | None Available | |
| Solomon Troy Inv | $630,000 | None Available | |
| Solomon Troy Inv | $630,000 | None Available |
Source: Public Records
Mortgage History
| Date | Status | Borrower | Loan Amount |
|---|---|---|---|
| Open | Svt Properties Llc | $655,200 | |
| Closed | Svt Properties Llc | $655,200 | |
| Previous Owner | Solomon Troy Inv | $409,500 |
Source: Public Records
Tax History
| Year | Tax Paid | Tax Assessment Tax Assessment Total Assessment is a certain percentage of the fair market value that is determined by local assessors to be the total taxable value of land and additions on the property. | Land | Improvement |
|---|---|---|---|---|
| 2025 | $12,705 | $507,200 | $29,570 | $477,630 |
| 2024 | $12,128 | $507,200 | $29,570 | $477,630 |
| 2023 | $12,684 | $395,290 | $24,640 | $370,650 |
| 2022 | $11,934 | $395,290 | $24,640 | $370,650 |
| 2021 | $11,934 | $395,290 | $24,640 | $370,650 |
| 2020 | $11,736 | $395,290 | $24,640 | $370,650 |
| 2019 | $11,863 | $395,290 | $24,640 | $370,650 |
| 2017 | $12,269 | $380,310 | $24,640 | $355,670 |
| 2016 | $12,269 | $380,310 | $24,640 | $355,670 |
| 2015 | $12,022 | $380,310 | $24,640 | $355,670 |
| 2014 | $11,736 | $380,310 | $24,640 | $355,670 |
Source: Public Records
Map
Nearby Homes
Your Personal Tour Guide
Ask me questions while you tour the home.