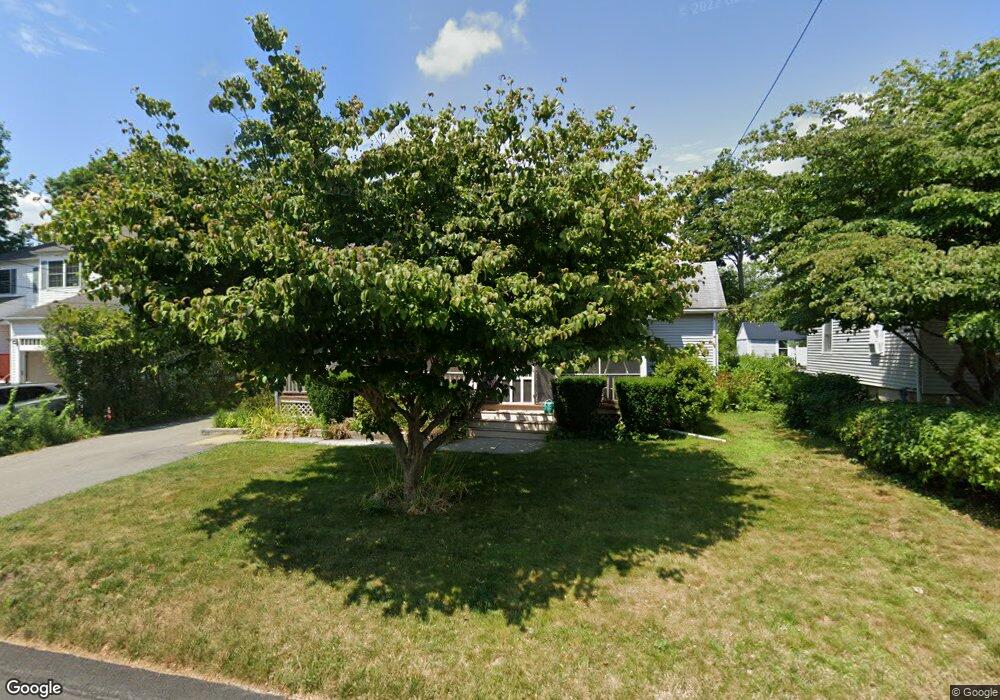
103 Maple St Needham, MA 02492
Estimated Value: $1,090,205 - $1,264,000
4
Beds
3
Baths
1,592
Sq Ft
$737/Sq Ft
Est. Value
About This Home
This home is located at 103 Maple St, Needham, MA 02492 and is currently estimated at $1,173,051, approximately $736 per square foot. 103 Maple St is a home located in Norfolk County with nearby schools including Newman Elementary School, High Rock Middle School, and Pollard Middle School.
Ownership History
Date
Name
Owned For
Owner Type
Purchase Details
Closed on
May 8, 1992
Sold by
Slicklen David M
Bought by
Sharpe Edward J and Sharpe Regina
Current Estimated Value
Home Financials for this Owner
Home Financials are based on the most recent Mortgage that was taken out on this home.
Original Mortgage
$65,000
Interest Rate
8.91%
Mortgage Type
Purchase Money Mortgage
Purchase Details
Closed on
Nov 27, 1991
Sold by
Dunphy Joan
Bought by
Slicken David
Create a Home Valuation Report for This Property
The Home Valuation Report is an in-depth analysis detailing your home's value as well as a comparison with similar homes in the area
Home Values in the Area
Average Home Value in this Area
Purchase History
| Date | Buyer | Sale Price | Title Company |
|---|---|---|---|
| Sharpe Edward J | $243,500 | -- | |
| Slicken David | $105,000 | -- |
Source: Public Records
Mortgage History
| Date | Status | Borrower | Loan Amount |
|---|---|---|---|
| Open | Slicken David | $50,000 | |
| Closed | Slicken David | $57,000 | |
| Closed | Slicken David | $65,000 |
Source: Public Records
Tax History
| Year | Tax Paid | Tax Assessment Tax Assessment Total Assessment is a certain percentage of the fair market value that is determined by local assessors to be the total taxable value of land and additions on the property. | Land | Improvement |
|---|---|---|---|---|
| 2025 | $10,671 | $1,006,700 | $723,700 | $283,000 |
| 2024 | $11,317 | $903,900 | $528,200 | $375,700 |
| 2023 | $11,452 | $878,200 | $528,200 | $350,000 |
| 2022 | $11,192 | $837,100 | $498,400 | $338,700 |
| 2021 | $10,907 | $837,100 | $498,400 | $338,700 |
| 2020 | $10,492 | $840,000 | $498,400 | $341,600 |
| 2019 | $9,719 | $784,400 | $453,300 | $331,100 |
| 2018 | $9,319 | $784,400 | $453,300 | $331,100 |
| 2017 | $8,878 | $746,700 | $453,300 | $293,400 |
| 2016 | $8,634 | $748,200 | $453,300 | $294,900 |
| 2015 | $8,447 | $748,200 | $453,300 | $294,900 |
| 2014 | $7,991 | $686,500 | $412,300 | $274,200 |
Source: Public Records
Map
Nearby Homes
- 73 Maple St Unit 1
- 34 Lincoln St Unit 34
- 18 Grant St Unit 2
- 193 Garden St
- 68 Pleasant St Unit 68
- 361 High Rock St
- 287 High Rock St
- 971 Webster St
- 150 Laurel Dr
- 1011 Webster St
- 95 Deerfield Rd
- 569 Chestnut St
- 1034 Webster St
- 100 Bradford St
- 19 Oakland Ave Unit 19
- 88 Robinwood Ave
- 60 Sutton Rd
- 75 High Rock St
- 383 Manning St
- 620 High Rock St
- 109 Maple St
- 111 Maple St
- 111 Maple St Unit 111
- 99 Maple St
- 60 Oak St
- 3 Maple Place
- 13 Maple Place
- 50 Oak St Unit 2
- 50 Oak St Unit 1
- 50 Oak St
- 11 Cypress St
- 52 Oak St
- 66 Oak St
- 106 Maple St
- 106 Maple St Unit A
- 106 Maple St Unit 2
- 106 Maple St Unit 1
- 102 Maple St Unit 1
- 110 Maple St Unit 110
- 112 Maple St
Your Personal Tour Guide
Ask me questions while you tour the home.