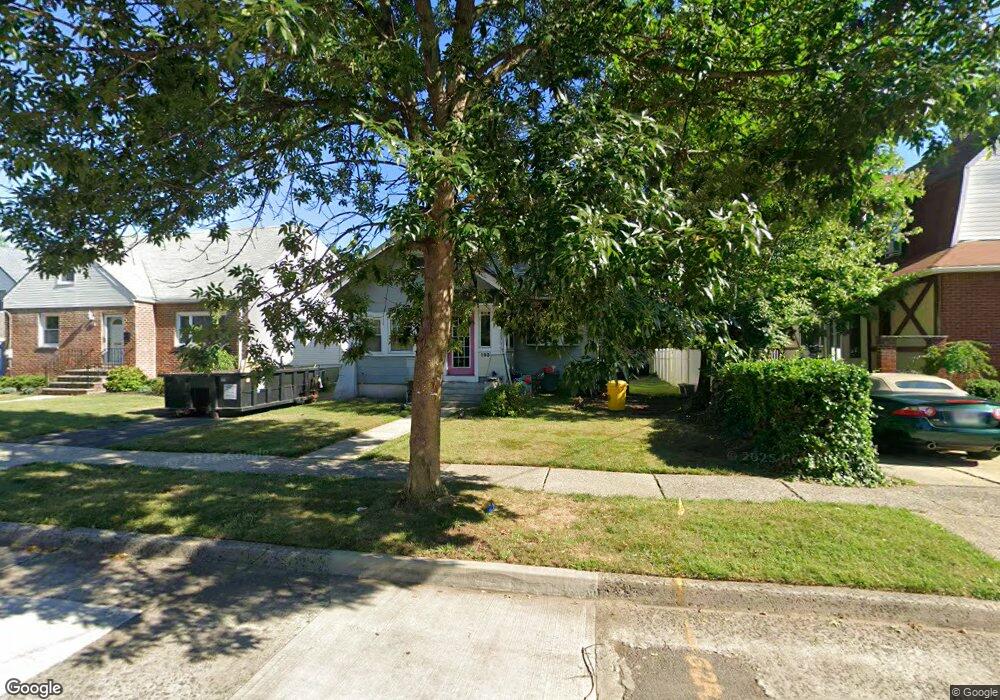
103 Maple St Teaneck, NJ 07666
Estimated Value: $552,483 - $692,000
Studio
--
Bath
1,494
Sq Ft
$402/Sq Ft
Est. Value
About This Home
This home is located at 103 Maple St, Teaneck, NJ 07666 and is currently estimated at $600,121, approximately $401 per square foot. 103 Maple St is a home located in Bergen County with nearby schools including Teaneck Senior High School, Academy of Greatness & Excellence, and Bogota Middle School.
Ownership History
Date
Name
Owned For
Owner Type
Purchase Details
Closed on
May 8, 1997
Sold by
Cerullo Wayne and Cerullo Christine
Bought by
Latimer Gary E and Moss Rhoda A
Current Estimated Value
Home Financials for this Owner
Home Financials are based on the most recent Mortgage that was taken out on this home.
Original Mortgage
$154,000
Outstanding Balance
$20,874
Interest Rate
7.88%
Estimated Equity
$579,247
Create a Home Valuation Report for This Property
The Home Valuation Report is an in-depth analysis detailing your home's value as well as a comparison with similar homes in the area
Home Values in the Area
Average Home Value in this Area
Purchase History
| Date | Buyer | Sale Price | Title Company |
|---|---|---|---|
| Latimer Gary E | $162,000 | -- |
Source: Public Records
Mortgage History
| Date | Status | Borrower | Loan Amount |
|---|---|---|---|
| Open | Latimer Gary E | $154,000 |
Source: Public Records
Tax History
| Year | Tax Paid | Tax Assessment Tax Assessment Total Assessment is a certain percentage of the fair market value that is determined by local assessors to be the total taxable value of land and additions on the property. | Land | Improvement |
|---|---|---|---|---|
| 2025 | $9,942 | $455,200 | $265,000 | $190,200 |
| 2024 | $8,427 | $455,200 | $265,000 | $190,200 |
| 2023 | $8,261 | $255,200 | $172,500 | $82,700 |
| 2022 | $8,261 | $255,200 | $172,500 | $82,700 |
| 2021 | $8,309 | $255,200 | $172,500 | $82,700 |
| 2020 | $8,253 | $255,200 | $172,500 | $82,700 |
| 2019 | $8,159 | $255,200 | $172,500 | $82,700 |
| 2018 | $8,098 | $255,200 | $172,500 | $82,700 |
| 2017 | $8,021 | $255,200 | $172,500 | $82,700 |
| 2016 | $7,901 | $255,200 | $172,500 | $82,700 |
| 2015 | $7,776 | $255,200 | $172,500 | $82,700 |
| 2014 | $8,744 | $340,100 | $220,000 | $120,100 |
Source: Public Records
Map
Nearby Homes
- 57 Park Ave
- 20 Maple St
- 44 Jasper Ave
- 159 Sherwood Ave
- 100 Arthur St
- 159 Henry St
- 203 Queen Anne Rd
- 203 Queen Anne Rd
- 227 Beechwood Ave
- 196 Fort Lee Rd
- 71 Gordon St
- 82 Hazelton St
- 290 Queen Anne Rd
- 133 Degraw Ave
- 51 Highland Place
- 50 Grand Ave
- 281 James St
- 58 Hillside Ave
- 221 4th St
- 114 Hackensack Ave