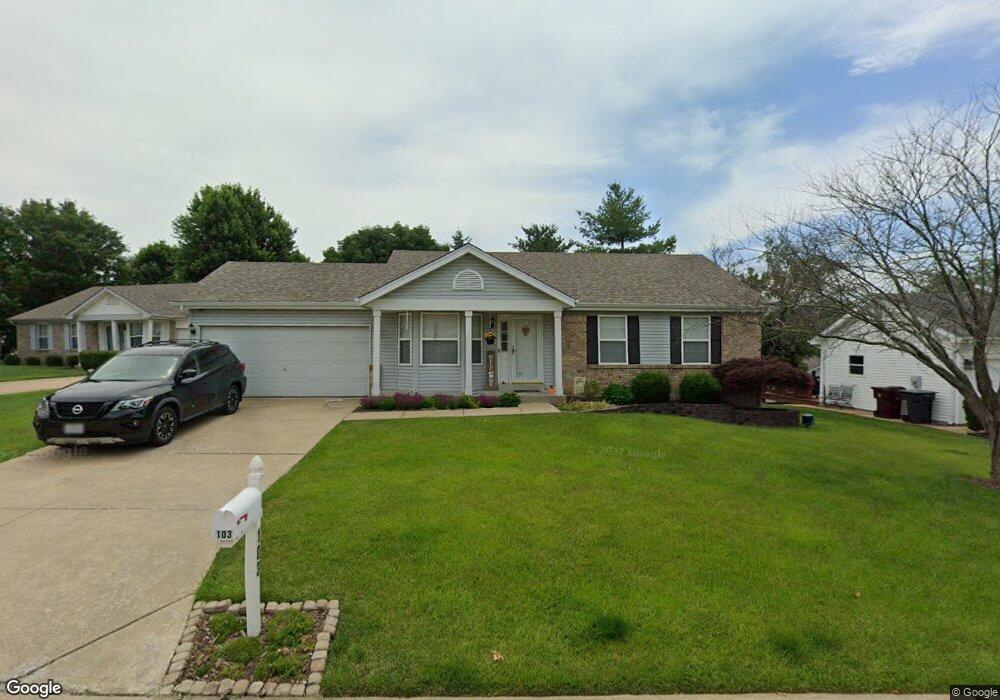
103 McClay Crossing Ct Saint Peters, MO 63376
Estimated Value: $309,373 - $321,000
3
Beds
2
Baths
1,154
Sq Ft
$272/Sq Ft
Est. Value
About This Home
This home is located at 103 McClay Crossing Ct, Saint Peters, MO 63376 and is currently estimated at $313,343, approximately $271 per square foot. 103 McClay Crossing Ct is a home located in St. Charles County with nearby schools including Fairmount Elementary School, Hollenbeck Middle School, and Francis Howell North High School.
Ownership History
Date
Name
Owned For
Owner Type
Purchase Details
Closed on
Feb 1, 2021
Sold by
Baur Mark D
Bought by
Baur Mark D and Baur Kathryn L
Current Estimated Value
Purchase Details
Closed on
May 15, 2003
Sold by
Block Darlene M
Bought by
Baur Mark D
Home Financials for this Owner
Home Financials are based on the most recent Mortgage that was taken out on this home.
Original Mortgage
$120,800
Outstanding Balance
$52,693
Interest Rate
5.84%
Mortgage Type
Purchase Money Mortgage
Estimated Equity
$260,650
Purchase Details
Closed on
Jun 15, 2001
Sold by
Block Daniel J
Bought by
Block Darlene M
Purchase Details
Closed on
Jun 24, 1998
Sold by
Block Daniel J Moran Darlene M and Block Darlene M
Bought by
Block Daniel J and Block Darlene M
Home Financials for this Owner
Home Financials are based on the most recent Mortgage that was taken out on this home.
Original Mortgage
$85,200
Interest Rate
7.13%
Create a Home Valuation Report for This Property
The Home Valuation Report is an in-depth analysis detailing your home's value as well as a comparison with similar homes in the area
Home Values in the Area
Average Home Value in this Area
Purchase History
| Date | Buyer | Sale Price | Title Company |
|---|---|---|---|
| Baur Mark D | -- | None Available | |
| Baur Mark D | $151,000 | -- | |
| Block Darlene M | -- | -- | |
| Block Daniel J | -- | Capital Title |
Source: Public Records
Mortgage History
| Date | Status | Borrower | Loan Amount |
|---|---|---|---|
| Open | Baur Mark D | $120,800 | |
| Previous Owner | Block Daniel J | $85,200 |
Source: Public Records
Tax History Compared to Growth
Tax History
| Year | Tax Paid | Tax Assessment Tax Assessment Total Assessment is a certain percentage of the fair market value that is determined by local assessors to be the total taxable value of land and additions on the property. | Land | Improvement |
|---|---|---|---|---|
| 2025 | $3,343 | $51,997 | -- | -- |
| 2024 | $3,343 | $47,792 | -- | -- |
| 2023 | $3,339 | $47,792 | $0 | $0 |
| 2022 | $3,066 | $40,953 | $0 | $0 |
| 2021 | $3,061 | $40,953 | $0 | $0 |
| 2020 | $2,427 | $31,625 | $0 | $0 |
| 2019 | $2,418 | $31,625 | $0 | $0 |
| 2018 | $2,490 | $31,250 | $0 | $0 |
| 2017 | $2,478 | $31,250 | $0 | $0 |
| 2016 | $2,310 | $29,169 | $0 | $0 |
| 2015 | $2,305 | $29,169 | $0 | $0 |
| 2014 | $2,281 | $28,060 | $0 | $0 |
Source: Public Records
Map
Nearby Homes
- 15 McClay Crossing Dr
- 2909 Cloverwoods Ln
- 14 Whitewood Ct
- 434 Saravalle Dr
- 1011 Saravalle Dr
- 1131 Saravalle Dr
- 1231 Saravalle Dr
- 3129 Mcclay Rd
- 12 Mill Brooke Dr
- 1052 Sugar Creek Ct Unit 7
- 2840 La Brea Dr
- 3018 Valley Ridge Dr
- 1019 Sugar Creek Ct Unit 7
- 1012 Sugar Creek Ct Unit 4
- 761 Sugar Glen Dr Unit 5
- 1001 Sugar Creek Ct Unit A
- 22 Mill Spring Ct
- 748 Sugar Glen Dr Unit 2
- 210 Sugar Lake Dr Unit 6
- 132 Mill Spring Ln
- 105 McClay Crossing Ct
- 101 McClay Crossing Ct
- 16 McClay Crossing Dr
- 33 McClay Trail Dr
- 102 McClay Crossing Dr
- 102 McClay Crossing Ct
- 18 McClay Crossing Dr
- 35 McClay Trail Dr
- 107 McClay Crossing Ct
- 100 McClay Crossing Ct
- 104 McClay Crossing Ct
- 37 McClay Trail Dr
- 108 McClay Crossing Ct
- 17 McClay Crossing Dr
- 13 McClay Crossing Dr
- 106 McClay Crossing Ct
- 19 McClay Crossing Dr
- 39 McClay Trail Dr
- 11 McClay Crossing Dr
- 34 McClay Trail Dr