Estimated Value: $299,199 - $369,000
3
Beds
2
Baths
1,887
Sq Ft
$176/Sq Ft
Est. Value
About This Home
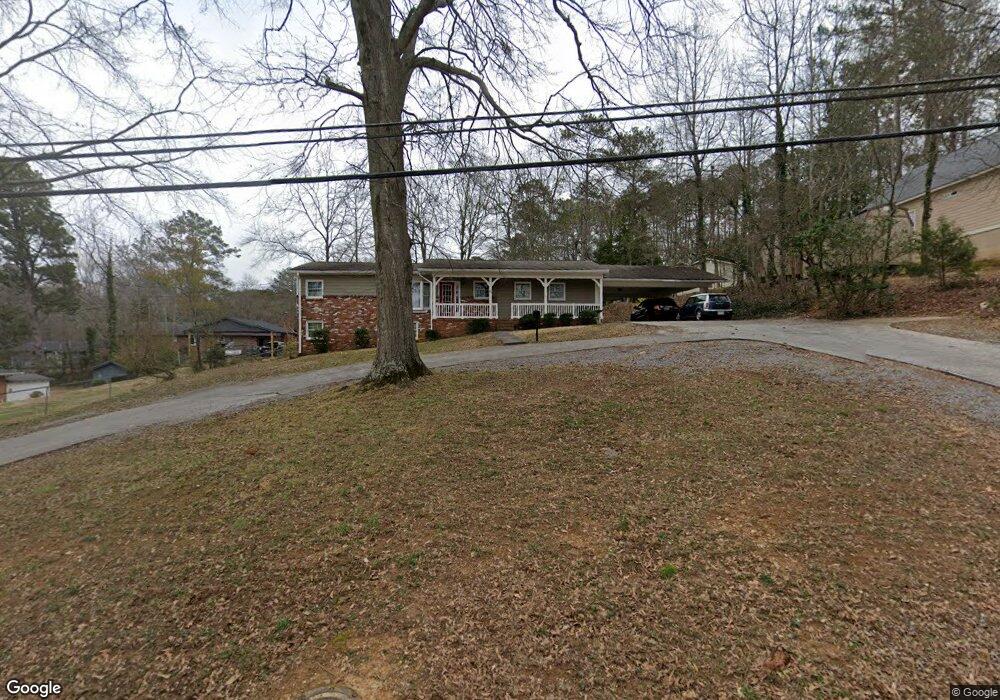
This home is located at 103 Mount Alto Rd SW, Rome, GA 30165 and is currently estimated at $332,550, approximately $176 per square foot. 103 Mount Alto Rd SW is a home located in Floyd County with nearby schools including Coosa Middle School, Coosa High School, and St. Mary School.
Ownership History
Date
Name
Owned For
Owner Type
Purchase Details
Closed on
Dec 29, 2009
Sold by
Floyd Mark E
Bought by
Hope David E
Current Estimated Value
Home Financials for this Owner
Home Financials are based on the most recent Mortgage that was taken out on this home.
Original Mortgage
$123,619
Outstanding Balance
$79,387
Interest Rate
4.68%
Mortgage Type
FHA
Estimated Equity
$253,163
Purchase Details
Closed on
Jun 11, 2009
Sold by
Citifinancial Svcs Inc
Bought by
Floyd Mark E
Purchase Details
Closed on
Aug 5, 2008
Sold by
Not Provided
Bought by
Hope David E
Purchase Details
Closed on
Mar 12, 1980
Sold by
Peters Gerald O and Peters Marsia O
Bought by
Combs James H and Combs Joan M
Purchase Details
Closed on
Sep 30, 1974
Sold by
P\R
Bought by
Peters Gerald O and Peters Marsia O
Purchase Details
Closed on
Jul 31, 1972
Sold by
Cobb Cobb S and Cobb Dana N
Bought by
P\R
Purchase Details
Closed on
Jan 1, 1960
Bought by
Boatwright C B
Create a Home Valuation Report for This Property
The Home Valuation Report is an in-depth analysis detailing your home's value as well as a comparison with similar homes in the area
Home Values in the Area
Average Home Value in this Area
Purchase History
| Date | Buyer | Sale Price | Title Company |
|---|---|---|---|
| Hope David E | $125,900 | -- | |
| Floyd Mark E | $40,000 | -- | |
| Hope David E | $89,029 | -- | |
| Citifinancial Svcs Inc | $89,029 | -- | |
| Combs James H | $44,300 | -- | |
| Peters Gerald O | $32,800 | -- | |
| P\R | $23,300 | -- | |
| Cobb Cobb S | -- | -- | |
| Boatwright C B | -- | -- |
Source: Public Records
Mortgage History
| Date | Status | Borrower | Loan Amount |
|---|---|---|---|
| Open | Floyd Mark E | $123,619 |
Source: Public Records
Tax History Compared to Growth
Tax History
| Year | Tax Paid | Tax Assessment Tax Assessment Total Assessment is a certain percentage of the fair market value that is determined by local assessors to be the total taxable value of land and additions on the property. | Land | Improvement |
|---|---|---|---|---|
| 2024 | $2,278 | $108,156 | $12,800 | $95,356 |
| 2023 | $2,296 | $104,721 | $11,600 | $93,121 |
| 2022 | $1,935 | $82,678 | $9,600 | $73,078 |
| 2021 | $1,721 | $69,185 | $9,600 | $59,585 |
| 2020 | $1,646 | $64,430 | $7,400 | $57,030 |
| 2019 | $1,580 | $61,740 | $7,400 | $54,340 |
| 2018 | $1,532 | $58,972 | $7,400 | $51,572 |
| 2017 | $1,476 | $55,743 | $7,400 | $48,343 |
| 2016 | $1,481 | $55,040 | $7,400 | $47,640 |
| 2015 | $1,284 | $46,149 | $7,400 | $38,749 |
| 2014 | $1,284 | $46,149 | $7,400 | $38,749 |
Source: Public Records
Map
Nearby Homes
- 13 Ridgewood Rd SW
- 0 Mount Alto Rd SW Unit 10523740
- 3 Berckman Ln SW
- 19 Berckman Ln SW
- 28 Mountain Crest Dr SW
- 204 Cherry St SW
- 50 Melton Ave SW
- 311 Wilkerson Rd SW
- 8 S Hughes St SW
- 313 Wilkerson Rd SW
- 209 Sherwood Rd SW
- 8 Silverbell Ln
- 4 Silverbell Ln
- 9 Shorter Cir SW
- 8 Leon St SW
- 438 Wilkerson Rd SW
- 6 Horseleg Creek Rd SW
- 40 Paris Dr SW
- 207 Paris Dr SW
- 21 Sweetspire Dr NW
- 105 Mount Alto Rd SW
- 8 Mccrary Dr SW
- 101 Mount Alto Rd SW
- 10 Mccrary Dr SW
- 10 Mccrary Dr SW
- 6 Mccrary Dr SW
- 104 Mount Alto Rd SW
- 102 Mount Alto Rd SW
- 106 Mount Alto Rd SW
- 1 Wilkerson Rd SW
- 0 Wilkerson Rd SW Unit 6064643
- 0 Wilkerson Rd SW Unit 8443744
- 0 Wilkerson Rd SW Unit 8268560
- 000 Wilkerson Rd SW
- 0 Wilkerson Rd SW Unit 20164289
- 0 Wilkerson Rd SW Unit 20054549
- 0 Wilkerson Rd SW Unit LOT 3 20053959
- 0 Wilkerson Rd SW Unit Lot 3 8706379
- 4 Mccrary Dr SW
- 13 Mount Alto Rd SW