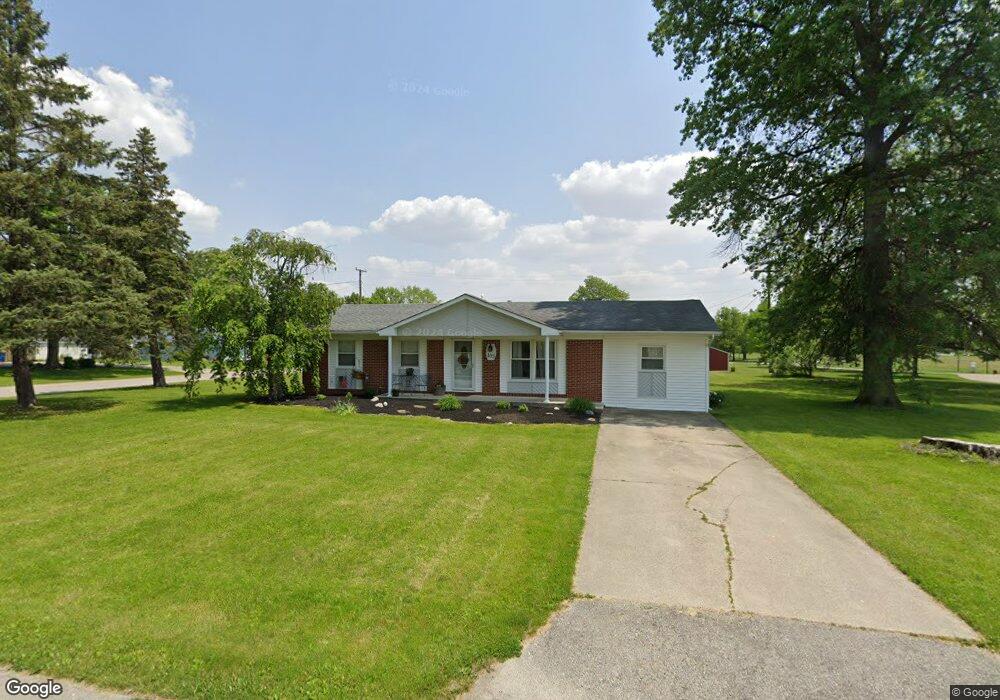
103 N Bunn St Ossian, IN 46777
Estimated Value: $192,000 - $216,000
3
Beds
2
Baths
1,248
Sq Ft
$164/Sq Ft
Est. Value
About This Home
This home is located at 103 N Bunn St, Ossian, IN 46777 and is currently estimated at $204,351, approximately $163 per square foot. 103 N Bunn St is a home located in Wells County with nearby schools including Norwell High School.
Ownership History
Date
Name
Owned For
Owner Type
Purchase Details
Closed on
Sep 23, 2011
Sold by
Pratt Leslie E
Bought by
Lewis Ashley R
Current Estimated Value
Home Financials for this Owner
Home Financials are based on the most recent Mortgage that was taken out on this home.
Original Mortgage
$100,000
Outstanding Balance
$69,371
Interest Rate
4.23%
Mortgage Type
New Conventional
Estimated Equity
$134,980
Purchase Details
Closed on
Mar 9, 2011
Sold by
Finance Corp
Bought by
Leslie E
Purchase Details
Closed on
Nov 17, 2010
Sold by
Bunn Carla and Bunn Troy
Bought by
Household Finance Corporation Iii
Create a Home Valuation Report for This Property
The Home Valuation Report is an in-depth analysis detailing your home's value as well as a comparison with similar homes in the area
Home Values in the Area
Average Home Value in this Area
Purchase History
| Date | Buyer | Sale Price | Title Company |
|---|---|---|---|
| Lewis Ashley R | $96,500 | John W Carnall & Sons Inc | |
| Leslie E | $47,000 | Escrow & Title Services Llc | |
| Household Finance Corporation Iii | $51,196 | None Available |
Source: Public Records
Mortgage History
| Date | Status | Borrower | Loan Amount |
|---|---|---|---|
| Open | Lewis Ashley R | $100,000 | |
| Closed | Leslie E | $0 |
Source: Public Records
Tax History Compared to Growth
Tax History
| Year | Tax Paid | Tax Assessment Tax Assessment Total Assessment is a certain percentage of the fair market value that is determined by local assessors to be the total taxable value of land and additions on the property. | Land | Improvement |
|---|---|---|---|---|
| 2024 | $982 | $163,800 | $38,900 | $124,900 |
| 2023 | $926 | $159,300 | $38,300 | $121,000 |
| 2022 | $741 | $135,900 | $23,700 | $112,200 |
| 2021 | $570 | $116,800 | $23,700 | $93,100 |
| 2020 | $495 | $114,600 | $23,700 | $90,900 |
| 2019 | $382 | $97,100 | $20,100 | $77,000 |
| 2018 | $385 | $97,900 | $16,300 | $81,600 |
| 2017 | $310 | $97,000 | $16,300 | $80,700 |
| 2016 | $297 | $94,200 | $15,800 | $78,400 |
| 2014 | $275 | $90,900 | $15,800 | $75,100 |
| 2013 | $240 | $89,000 | $15,800 | $73,200 |
Source: Public Records
Map
Nearby Homes
- 602 N Metts St
- 10221 Indiana 1
- TBD E 900 N
- 406 Piper Ct
- 410 Piper Ct
- 801 N Maxine Dr
- 305 Piper Ct
- Harmony Plan at Crosswind Lakes
- Chatham Plan at Crosswind Lakes
- 3667 E 1000 N
- 3703 E 1000 N
- 609 Greenwood Trail
- 504 Meadow Ln
- TBD N State Road 1
- TBD 850 N
- 10850 N State Road 1
- 4035 E 800 N
- 6936 N State Road 1
- 5144 E 1200 N-90 Unit 90
- 7805 N 600 E