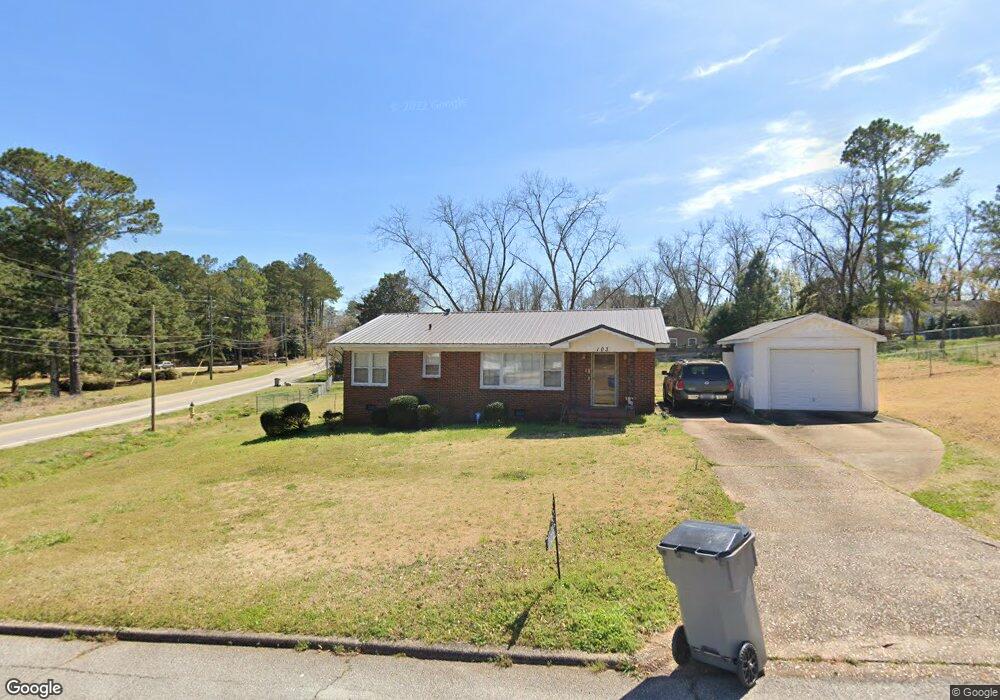
103 N Chilton Crescent Lagrange, GA 30240
Estimated Value: $171,727 - $215,000
3
Beds
1
Bath
1,189
Sq Ft
$160/Sq Ft
Est. Value
About This Home
This home is located at 103 N Chilton Crescent, Lagrange, GA 30240 and is currently estimated at $189,932, approximately $159 per square foot. 103 N Chilton Crescent is a home located in Troup County with nearby schools including Franklin Forest Elementary School, Hollis Hand Elementary School, and Ethel W. Kight Elementary School.
Ownership History
Date
Name
Owned For
Owner Type
Purchase Details
Closed on
Mar 20, 2001
Sold by
Margaret Berry Etal
Bought by
Harry Margaret D Etal
Current Estimated Value
Purchase Details
Closed on
Oct 26, 1998
Sold by
Margaret Harry
Bought by
Margaret Berry Etal
Purchase Details
Closed on
Nov 14, 1986
Sold by
Harry John L
Bought by
Margaret Harry
Purchase Details
Closed on
Jul 26, 1976
Sold by
Smith Charles R
Bought by
Harry John L
Purchase Details
Closed on
Jul 7, 1976
Sold by
Smith Wm A
Bought by
Smith Charles R
Purchase Details
Closed on
Feb 23, 1974
Sold by
Eades Arnold L and Eades Barbara J
Bought by
Smith Wm A
Purchase Details
Closed on
Sep 1, 1969
Sold by
Pepper Walter B
Bought by
Eades Arnold L and Eades Barbara J
Purchase Details
Closed on
Jan 1, 1962
Sold by
Fuller Elbert
Bought by
Pepper Walter B
Create a Home Valuation Report for This Property
The Home Valuation Report is an in-depth analysis detailing your home's value as well as a comparison with similar homes in the area
Purchase History
| Date | Buyer | Sale Price | Title Company |
|---|---|---|---|
| Harry Margaret D Etal | -- | -- | |
| Margaret Berry Etal | -- | -- | |
| Margaret Harry | -- | -- | |
| Harry John L | $27,000 | -- | |
| Smith Charles R | -- | -- | |
| Smith Wm A | $18,500 | -- | |
| Eades Arnold L | -- | -- | |
| Pepper Walter B | -- | -- |
Source: Public Records
Tax History
| Year | Tax Paid | Tax Assessment Tax Assessment Total Assessment is a certain percentage of the fair market value that is determined by local assessors to be the total taxable value of land and additions on the property. | Land | Improvement |
|---|---|---|---|---|
| 2025 | $1,390 | $55,680 | $4,400 | $51,280 |
| 2024 | $1,256 | $48,040 | $4,400 | $43,640 |
| 2023 | $864 | $33,680 | $4,400 | $29,280 |
| 2022 | $841 | $32,120 | $4,400 | $27,720 |
| 2021 | $680 | $24,520 | $4,400 | $20,120 |
| 2020 | $680 | $24,520 | $4,400 | $20,120 |
| 2019 | $639 | $23,160 | $4,800 | $18,360 |
| 2018 | $639 | $23,160 | $4,800 | $18,360 |
| 2017 | $639 | $23,160 | $4,800 | $18,360 |
| 2016 | $622 | $22,594 | $4,800 | $17,794 |
| 2015 | $658 | $23,764 | $4,429 | $19,335 |
| 2014 | $628 | $22,746 | $4,429 | $18,318 |
| 2013 | -- | $23,831 | $4,368 | $19,463 |
Source: Public Records
Map
Nearby Homes
- 102 Beech Creek Dr
- 201 S Chilton Crescent
- 204 Dixie Creek Dr
- 732 Camellia Dr
- 203 S Chilton Crescent
- 724 Camellia Dr
- 106 Ewing St
- 204 Colonial St
- 104 Sweetgum Dr
- 806 New Franklin Rd
- 110 Russell St
- 114 Briarcliff Rd
- 900 North St
- 134 S Page St
- 222 Beechwood Cir
- 1784 Mooty Bridge Rd
- 109 Thomas St
- 202 Park Hill Dr
- 219 Banks St
- 102 Dogwood Dr
- 1147 Mooty Bridge Rd
- 105 N Chilton Crescent
- 1245 Mooty Bridge Rd
- 1145 Mooty Bridge Rd
- 105 Wynnwood Dr
- 108 S Chilton Crescent
- 108 N Chilton Crescent
- 109 N Chilton Crescent
- 110 S Chilton Crescent
- 106 S Chilton Crescent
- 112 S Chilton Crescent
- 110 N Chilton Crescent
- 110 N Chilton Crescent Unit 4
- 111 N Chilton Crescent
- 107 Wynnwood Dr Unit B
- 107 Wynnwood Dr
- 107 Wynnwood Dr Unit C
- 107 Wynnwood Dr Unit A
- 107 Wynnwood Dr Unit D
- 107 Wynnwood Dr Unit A-D
Your Personal Tour Guide
Ask me questions while you tour the home.