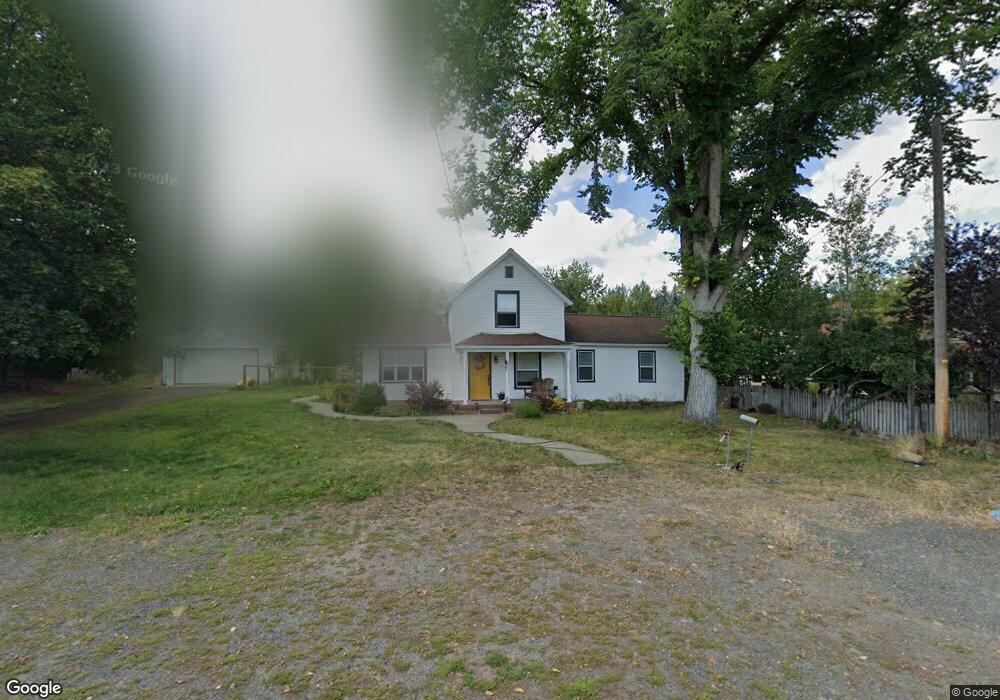
103 N Mill St Joseph, OR 97846
Estimated Value: $381,715 - $448,000
3
Beds
1
Bath
1,524
Sq Ft
$276/Sq Ft
Est. Value
About This Home
This home is located at 103 N Mill St, Joseph, OR 97846 and is currently estimated at $421,179, approximately $276 per square foot. 103 N Mill St is a home with nearby schools including Imnaha Elementary School and Joseph Charter School.
Ownership History
Date
Name
Owned For
Owner Type
Purchase Details
Closed on
Jun 23, 2022
Sold by
Williams Robert S
Bought by
Losby Jacob L and Losby Olivia J
Current Estimated Value
Home Financials for this Owner
Home Financials are based on the most recent Mortgage that was taken out on this home.
Original Mortgage
$200,000
Outstanding Balance
$189,537
Interest Rate
5.3%
Mortgage Type
New Conventional
Estimated Equity
$231,642
Purchase Details
Closed on
Jun 3, 2019
Sold by
Williams Robert S and Williams Stephanie F
Bought by
Williams Robert S
Home Financials for this Owner
Home Financials are based on the most recent Mortgage that was taken out on this home.
Original Mortgage
$224,000
Interest Rate
4.2%
Mortgage Type
New Conventional
Create a Home Valuation Report for This Property
The Home Valuation Report is an in-depth analysis detailing your home's value as well as a comparison with similar homes in the area
Purchase History
| Date | Buyer | Sale Price | Title Company |
|---|---|---|---|
| Losby Jacob L | $375,000 | Wallowa Title | |
| Williams Robert S | -- | Nations Lending Services |
Source: Public Records
Mortgage History
| Date | Status | Borrower | Loan Amount |
|---|---|---|---|
| Open | Losby Jacob L | $200,000 | |
| Previous Owner | Williams Robert S | $224,000 |
Source: Public Records
Tax History
| Year | Tax Paid | Tax Assessment Tax Assessment Total Assessment is a certain percentage of the fair market value that is determined by local assessors to be the total taxable value of land and additions on the property. | Land | Improvement |
|---|---|---|---|---|
| 2025 | $2,195 | $178,835 | $43,576 | $135,259 |
| 2024 | $2,131 | $173,627 | $42,599 | $131,028 |
| 2023 | $2,069 | $168,570 | $47,126 | $121,444 |
| 2022 | $2,009 | $163,661 | $46,254 | $117,407 |
| 2021 | $1,950 | $158,895 | $49,261 | $109,634 |
| 2020 | $1,962 | $154,267 | $60,955 | $93,312 |
| 2019 | $1,908 | $149,774 | $60,934 | $88,840 |
| 2018 | $1,856 | $145,412 | $59,534 | $85,878 |
| 2017 | $1,805 | $141,177 | $57,760 | $83,417 |
| 2016 | $1,755 | $137,066 | $0 | $0 |
| 2015 | $1,706 | $133,074 | $54,496 | $78,578 |
| 2014 | $1,660 | $129,199 | $53,143 | $76,056 |
| 2013 | $1,613 | $125,436 | $49,592 | $75,844 |
Source: Public Records
Map
Nearby Homes
- 204 N Russell St
- 104 N College St
- 0 Hwy 82 Main St Unit 484046347
- 612 N Mill St
- 0 Simeon Unit 774372374
- 602 N Simeon St
- 710 N Mill St
- 0 E Daggett St
- 0 5th St Unit 693144809
- 0 E Fifth St Unit 768527417
- 802 Engleside Ave
- 719 N East St
- 100 W 10th St
- 82757 Joseph Hwy
- 0 Russell Ln Unit 761772670
- 83440 Russell Ln
- 80071 Countryside Rd
- 0 Chief Joseph Loop Rd
- 83863 Ollokot Ln
- 0 Lake Shore Rd Unit 149390254
Your Personal Tour Guide
Ask me questions while you tour the home.