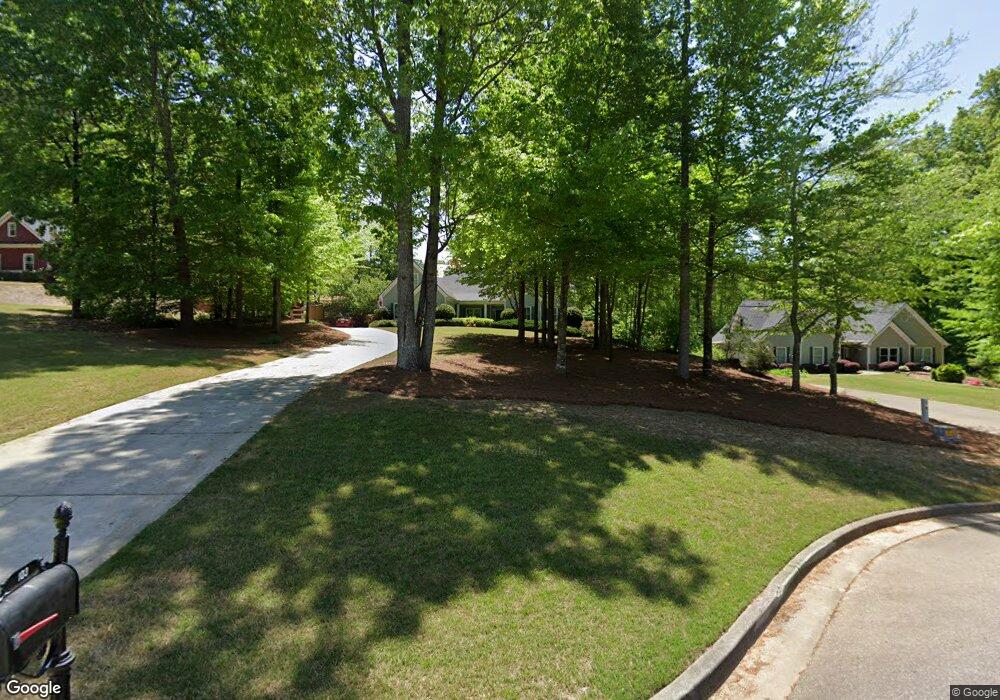
103 New Cut Rd Winder, GA 30680
Estimated Value: $458,195 - $524,000
3
Beds
3
Baths
2,982
Sq Ft
$160/Sq Ft
Est. Value
About This Home
This home is located at 103 New Cut Rd, Winder, GA 30680 and is currently estimated at $478,549, approximately $160 per square foot. 103 New Cut Rd is a home located in Barrow County with nearby schools including County Line Elementary School, Russell Middle School, and Winder-Barrow High School.
Ownership History
Date
Name
Owned For
Owner Type
Purchase Details
Closed on
Jul 15, 2013
Sold by
Hale Janice And
Bought by
Hale Janice And
Current Estimated Value
Home Financials for this Owner
Home Financials are based on the most recent Mortgage that was taken out on this home.
Original Mortgage
$168,800
Outstanding Balance
$123,157
Interest Rate
4%
Mortgage Type
New Conventional
Estimated Equity
$355,392
Purchase Details
Closed on
Jul 31, 2006
Sold by
Epicurus Inv Llc
Bought by
Hale Janice and Hale John M
Home Financials for this Owner
Home Financials are based on the most recent Mortgage that was taken out on this home.
Original Mortgage
$180,000
Interest Rate
6.74%
Mortgage Type
New Conventional
Purchase Details
Closed on
Jan 14, 2005
Sold by
Ripp Star Development Llc
Bought by
Epicurus Investments Llc
Purchase Details
Closed on
Aug 15, 2003
Bought by
Ripp Star Development Llc
Create a Home Valuation Report for This Property
The Home Valuation Report is an in-depth analysis detailing your home's value as well as a comparison with similar homes in the area
Home Values in the Area
Average Home Value in this Area
Purchase History
| Date | Buyer | Sale Price | Title Company |
|---|---|---|---|
| Hale Janice And | -- | -- | |
| Hale Janice | $250,100 | -- | |
| Epicurus Investments Llc | $42,000 | -- | |
| Ripp Star Development Llc | -- | -- |
Source: Public Records
Mortgage History
| Date | Status | Borrower | Loan Amount |
|---|---|---|---|
| Open | Hale Janice And | $168,800 | |
| Previous Owner | Hale Janice | $180,000 |
Source: Public Records
Tax History Compared to Growth
Tax History
| Year | Tax Paid | Tax Assessment Tax Assessment Total Assessment is a certain percentage of the fair market value that is determined by local assessors to be the total taxable value of land and additions on the property. | Land | Improvement |
|---|---|---|---|---|
| 2024 | $2,687 | $160,802 | $29,600 | $131,202 |
| 2023 | $2,305 | $161,802 | $29,600 | $132,202 |
| 2022 | $2,358 | $135,072 | $29,600 | $105,472 |
| 2021 | $1,700 | $107,594 | $17,600 | $89,994 |
| 2020 | $1,462 | $99,856 | $17,600 | $82,256 |
| 2019 | $1,509 | $99,856 | $17,600 | $82,256 |
| 2018 | $1,401 | $97,439 | $17,600 | $79,839 |
| 2017 | $2,494 | $85,667 | $17,600 | $68,067 |
| 2016 | $738 | $70,131 | $17,600 | $52,531 |
| 2015 | $2,115 | $70,691 | $17,600 | $53,091 |
| 2014 | $1,890 | $62,275 | $8,624 | $53,651 |
| 2013 | -- | $58,867 | $8,624 | $50,243 |
Source: Public Records
Map
Nearby Homes
- 731 Lincoln Dr
- 137 New Cut Rd
- The Paisley Plan at Rockwell Farms
- The Rockwell Plan at Rockwell Farms
- The Barnes Plan at Rockwell Farms
- The Reynolds Plan at Rockwell Farms
- The Austin Plan at Rockwell Farms
- The Logan Plan at Rockwell Farms
- The Rose II Plan at Rockwell Farms
- 1686 Shadowstone Ct
- 2858 Shadowstone Way
- 1931 Windstone Place
- 1929 Windstone Place
- 1557 Shadowstone Cir
- 615 Wellington Dr
- 72 Mcmillian Ct
- 2839 Shadowstone Way
- 809 Custom Ln
- 99 Mcmillian Ct
- 926 Live Oak Ct Unit 2
- 105 New Cut Rd
- 105 New Cut Rd Unit 50
- 101 New Cut Rd
- 102 New Cut Rd
- 109 New Cut Rd
- 109 New Cut Rd Unit 51
- 106 New Cut Rd
- 100 New Cut Rd
- 110 New Cut Rd
- 108 New Cut Rd
- 238 Pinehurst Dr
- 221 Pinehurst Dr
- 116 New Cut Rd
- 115 New Cut Rd Unit 54
- 115 New Cut Rd
- 208 Canyon Ct
- 206 Canyon Ct
- 210 Canyon Ct
- 117 New Cut Rd
- 114 Pinehurst Dr