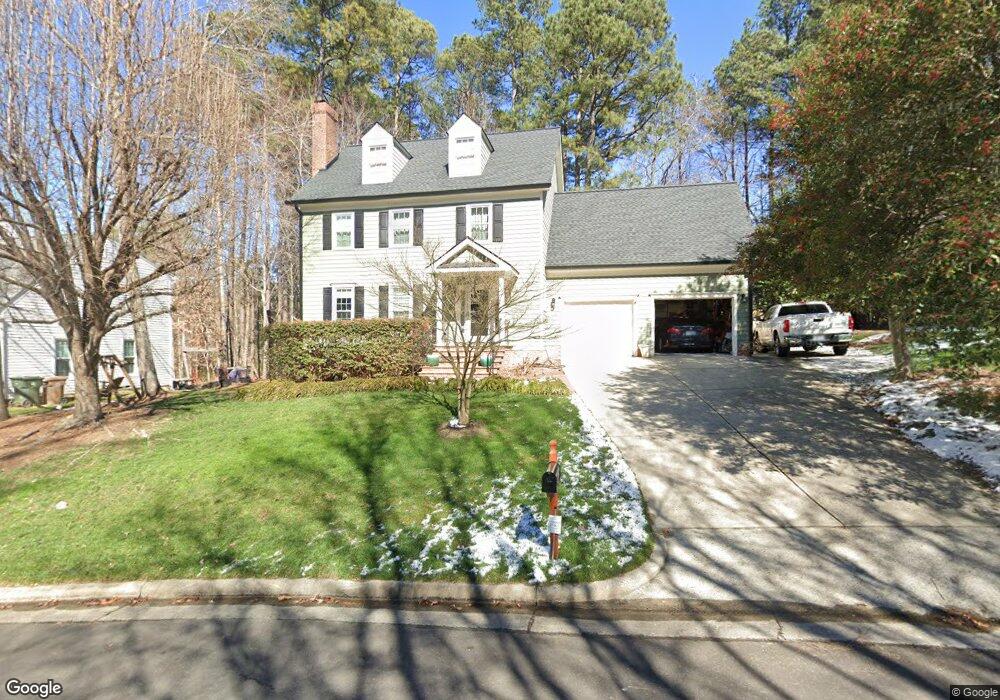
103 Parkknoll Ln Cary, NC 27519
West Cary NeighborhoodEstimated Value: $674,000 - $783,000
3
Beds
3
Baths
2,599
Sq Ft
$280/Sq Ft
Est. Value
About This Home
This home is located at 103 Parkknoll Ln, Cary, NC 27519 and is currently estimated at $728,908, approximately $280 per square foot. 103 Parkknoll Ln is a home located in Wake County with nearby schools including Davis Drive Elementary, Davis Drive Middle, and Green Hope High.
Ownership History
Date
Name
Owned For
Owner Type
Purchase Details
Closed on
Aug 20, 2012
Sold by
Kyte Phillip J and Ng Laingor
Bought by
Vannais Christine and Cone James A
Current Estimated Value
Home Financials for this Owner
Home Financials are based on the most recent Mortgage that was taken out on this home.
Original Mortgage
$244,000
Outstanding Balance
$168,075
Interest Rate
3.55%
Mortgage Type
New Conventional
Estimated Equity
$560,833
Purchase Details
Closed on
Jul 15, 2005
Sold by
Mazanec Ted J and Mazanec Catherine Greer
Bought by
Kyte Phillip J and Ng Laingor
Home Financials for this Owner
Home Financials are based on the most recent Mortgage that was taken out on this home.
Original Mortgage
$100,000
Interest Rate
5.54%
Mortgage Type
Fannie Mae Freddie Mac
Purchase Details
Closed on
Aug 2, 1999
Sold by
Mazanec Kimberly L
Bought by
Mazanec Ted J
Create a Home Valuation Report for This Property
The Home Valuation Report is an in-depth analysis detailing your home's value as well as a comparison with similar homes in the area
Home Values in the Area
Average Home Value in this Area
Purchase History
| Date | Buyer | Sale Price | Title Company |
|---|---|---|---|
| Vannais Christine | $305,000 | None Available | |
| Kyte Phillip J | $272,000 | -- | |
| Mazanec Ted J | -- | -- |
Source: Public Records
Mortgage History
| Date | Status | Borrower | Loan Amount |
|---|---|---|---|
| Open | Vannais Christine | $244,000 | |
| Previous Owner | Kyte Phillip J | $100,000 |
Source: Public Records
Tax History Compared to Growth
Tax History
| Year | Tax Paid | Tax Assessment Tax Assessment Total Assessment is a certain percentage of the fair market value that is determined by local assessors to be the total taxable value of land and additions on the property. | Land | Improvement |
|---|---|---|---|---|
| 2025 | $5,450 | $633,538 | $240,000 | $393,538 |
| 2024 | $5,332 | $633,538 | $240,000 | $393,538 |
| 2023 | $3,621 | $359,373 | $80,000 | $279,373 |
| 2022 | $3,486 | $359,373 | $80,000 | $279,373 |
| 2021 | $3,416 | $359,373 | $80,000 | $279,373 |
| 2020 | $3,434 | $359,373 | $80,000 | $279,373 |
| 2019 | $3,734 | $346,901 | $98,000 | $248,901 |
| 2018 | $3,454 | $341,886 | $98,000 | $243,886 |
| 2017 | $3,319 | $341,886 | $98,000 | $243,886 |
| 2016 | $3,270 | $341,886 | $98,000 | $243,886 |
| 2015 | $3,311 | $334,307 | $90,000 | $244,307 |
| 2014 | $3,122 | $330,863 | $90,000 | $240,863 |
Source: Public Records
Map
Nearby Homes
- 322 Parkmeadow Dr
- 306 Parkknoll Ln
- 209 Parkmeadow Dr
- 302 Parkbranch Ln
- 203 Caraway Ln
- 205 Caniff Ln
- 410 Widdington Ln
- 302 Caraway Ln
- 440 Creekhurst Place
- 224 Birdsgrove Ct
- 206 Highfield Ave
- 437 Henmore Brook Dr
- 313 Alliance Cir
- 1203 Corkery Ridge Ct
- 108 Ferncroft Ct
- 100 Citrus Place
- 102 W Hill Dr
- 112 Amiable Loop
- 324 Farrow Glen Loop
- 424 Euphoria Cir
- 105 Parkknoll Ln
- 101 Parkknoll Ln
- 327 Parkmeadow Dr
- 325 Parkmeadow Dr
- 329 Parkmeadow Dr
- 104 Parkknoll Ln
- 201 Parkknoll Ln
- 323 Parkmeadow Dr
- 100 Parkknoll Ln
- 200 Parkknoll Ln
- 321 Parkmeadow Dr
- 320 Parkmeadow Dr
- 203 Parkknoll Ln
- 318 Parkmeadow Dr
- 102 Parktree Ct
- 319 Parkmeadow Dr
- 316 Parkmeadow Dr
- 206 Parkknoll Ln
- 317 Parkmeadow Dr
- 205 Parkknoll Ln