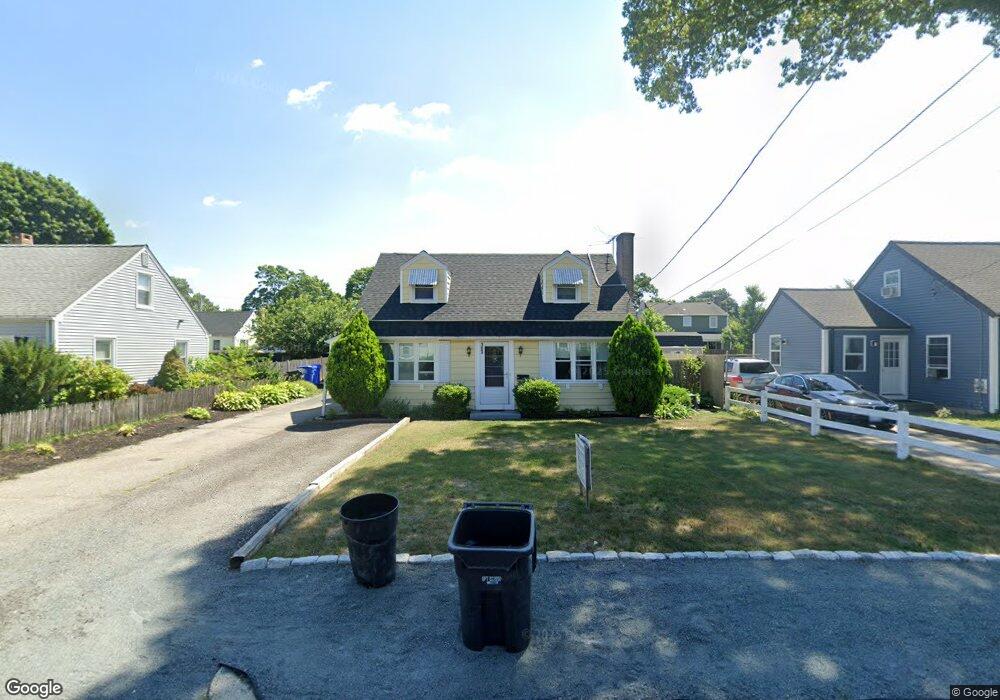
103 Rice St Pawtucket, RI 02861
Darlington NeighborhoodEstimated Value: $412,439 - $454,000
4
Beds
2
Baths
1,724
Sq Ft
$249/Sq Ft
Est. Value
About This Home
This home is located at 103 Rice St, Pawtucket, RI 02861 and is currently estimated at $429,360, approximately $249 per square foot. 103 Rice St is a home located in Providence County with nearby schools including St Cecilia School and Dayspring Christian Academy.
Ownership History
Date
Name
Owned For
Owner Type
Purchase Details
Closed on
Jan 23, 2024
Sold by
Caliri Bruce D and Caliri Cheryl
Bought by
Bruce D & C A Caliri Ret and Caliri
Current Estimated Value
Purchase Details
Closed on
Dec 29, 2004
Sold by
Flanagan Elizabeth A
Bought by
Caliri Bruce D and Caliri Cheryl
Purchase Details
Closed on
Nov 1, 1990
Sold by
Martin Richard A
Bought by
Flanagan Thomas J
Purchase Details
Closed on
Dec 7, 1989
Sold by
Pirri Angelo R
Bought by
Martin Richard A
Create a Home Valuation Report for This Property
The Home Valuation Report is an in-depth analysis detailing your home's value as well as a comparison with similar homes in the area
Home Values in the Area
Average Home Value in this Area
Purchase History
| Date | Buyer | Sale Price | Title Company |
|---|---|---|---|
| Bruce D & C A Caliri Ret | -- | None Available | |
| Caliri Bruce D | $235,000 | -- | |
| Flanagan Thomas J | $129,000 | -- | |
| Martin Richard A | $139,000 | -- |
Source: Public Records
Mortgage History
| Date | Status | Borrower | Loan Amount |
|---|---|---|---|
| Previous Owner | Martin Richard A | $1,561 | |
| Previous Owner | Martin Richard A | $166,400 | |
| Previous Owner | Martin Richard A | $10,000 |
Source: Public Records
Tax History Compared to Growth
Tax History
| Year | Tax Paid | Tax Assessment Tax Assessment Total Assessment is a certain percentage of the fair market value that is determined by local assessors to be the total taxable value of land and additions on the property. | Land | Improvement |
|---|---|---|---|---|
| 2025 | $4,343 | $330,300 | $149,900 | $180,400 |
| 2024 | $4,076 | $330,300 | $149,900 | $180,400 |
| 2023 | $4,169 | $246,100 | $91,600 | $154,500 |
| 2022 | $4,080 | $246,100 | $91,600 | $154,500 |
| 2021 | $4,080 | $246,100 | $91,600 | $154,500 |
| 2020 | $4,003 | $191,600 | $79,800 | $111,800 |
| 2019 | $4,003 | $191,600 | $79,800 | $111,800 |
| 2018 | $3,857 | $191,600 | $79,800 | $111,800 |
| 2017 | $3,935 | $173,200 | $73,300 | $99,900 |
| 2016 | $3,791 | $173,200 | $73,300 | $99,900 |
| 2015 | $3,791 | $173,200 | $73,300 | $99,900 |
| 2014 | $3,466 | $150,300 | $61,000 | $89,300 |
Source: Public Records
Map
Nearby Homes