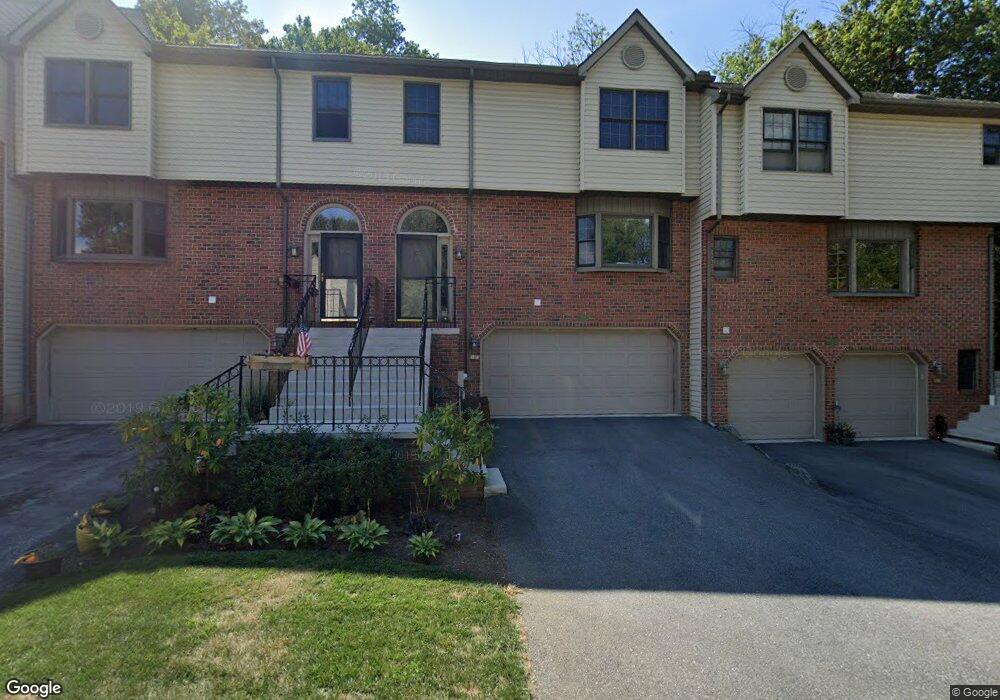
103 River Bend Park Unit 103 Lancaster, PA 17602
Bridgeport NeighborhoodEstimated Value: $320,157 - $376,000
2
Beds
2
Baths
1,800
Sq Ft
$196/Sq Ft
Est. Value
About This Home
This home is located at 103 River Bend Park Unit 103, Lancaster, PA 17602 and is currently estimated at $352,039, approximately $195 per square foot. 103 River Bend Park Unit 103 is a home located in Lancaster County with nearby schools including Lampeter Elementary School, Hans Herr Elementary School, and Martin Meylin Middle School.
Ownership History
Date
Name
Owned For
Owner Type
Purchase Details
Closed on
Oct 14, 2011
Sold by
Wise Susan M
Bought by
Murray Charles C and Murray Robbin L
Current Estimated Value
Home Financials for this Owner
Home Financials are based on the most recent Mortgage that was taken out on this home.
Original Mortgage
$150,356
Outstanding Balance
$102,598
Interest Rate
4.11%
Mortgage Type
VA
Estimated Equity
$249,441
Purchase Details
Closed on
Apr 27, 2007
Sold by
Cr Realty Llc
Bought by
Wise Jeffrey and Wise Susan M
Home Financials for this Owner
Home Financials are based on the most recent Mortgage that was taken out on this home.
Original Mortgage
$144,000
Interest Rate
6.18%
Mortgage Type
Purchase Money Mortgage
Purchase Details
Closed on
Jan 30, 2007
Sold by
Massarella S J and Massarella Patsy L
Bought by
Cr Realty Llc
Create a Home Valuation Report for This Property
The Home Valuation Report is an in-depth analysis detailing your home's value as well as a comparison with similar homes in the area
Home Values in the Area
Average Home Value in this Area
Purchase History
| Date | Buyer | Sale Price | Title Company |
|---|---|---|---|
| Murray Charles C | $165,000 | None Available | |
| Wise Jeffrey | $180,000 | None Available | |
| Cr Realty Llc | $145,000 | None Available |
Source: Public Records
Mortgage History
| Date | Status | Borrower | Loan Amount |
|---|---|---|---|
| Open | Murray Charles C | $150,356 | |
| Previous Owner | Wise Jeffrey | $144,000 |
Source: Public Records
Tax History
| Year | Tax Paid | Tax Assessment Tax Assessment Total Assessment is a certain percentage of the fair market value that is determined by local assessors to be the total taxable value of land and additions on the property. | Land | Improvement |
|---|---|---|---|---|
| 2025 | $4,111 | $185,800 | -- | $185,800 |
| 2024 | $4,111 | $185,800 | -- | $185,800 |
| 2023 | $4,020 | $185,800 | $0 | $185,800 |
| 2022 | $3,959 | $185,800 | $0 | $185,800 |
| 2021 | $3,866 | $185,800 | $0 | $185,800 |
| 2020 | $3,866 | $185,800 | $0 | $185,800 |
| 2019 | $3,813 | $185,800 | $0 | $185,800 |
| 2018 | $2,985 | $185,800 | $0 | $185,800 |
| 2017 | $3,692 | $146,600 | $0 | $146,600 |
| 2016 | $3,691 | $146,600 | $0 | $146,600 |
| 2015 | $723 | $146,600 | $0 | $146,600 |
| 2014 | $2,766 | $146,600 | $0 | $146,600 |
Source: Public Records
Map
Nearby Homes
- 806 Lightfoot Dr
- 133 Conestoga Blvd
- 257 Longfellow Dr
- 38 Conestoga Dr
- 516 Conestoga Greenway Trail
- 647 S Franklin St
- 1829 Krystle Dr
- 1036 E King St
- 47 Riverside Ave
- 464 S Ann St
- 70 Chesapeake St
- 911 E King St
- 980 E Orange St
- 32 Greenfield Rd
- 227 S Ann St
- 121 S Marshall St
- 8 White Tail Path
- 225 Dauphin St
- 561 S Lime St
- 53 S Marshall St
- 103 River Bend Park
- 104 River Bend Park
- 102 River Bend Park Unit 102
- 105 River Bend Park
- 97 River Bend Park
- 97 River Bend Park Unit 97
- 96 River Bend Park
- 96 River Bend Park Unit 96
- 101 River Bend Park Unit 101
- 106 River Bend Park
- 106 River Bend Park Unit 106
- 40 River Bend Park Unit 40
- 115 River Bend Park
- 115 River Bend Park Unit 125
- 95 River Bend Park
- 95 River Bend Park Unit 95
- 95 River Bend
- 100 River Bend Park
- 107 River Bend Park
- 41 River Bend Park
Your Personal Tour Guide
Ask me questions while you tour the home.