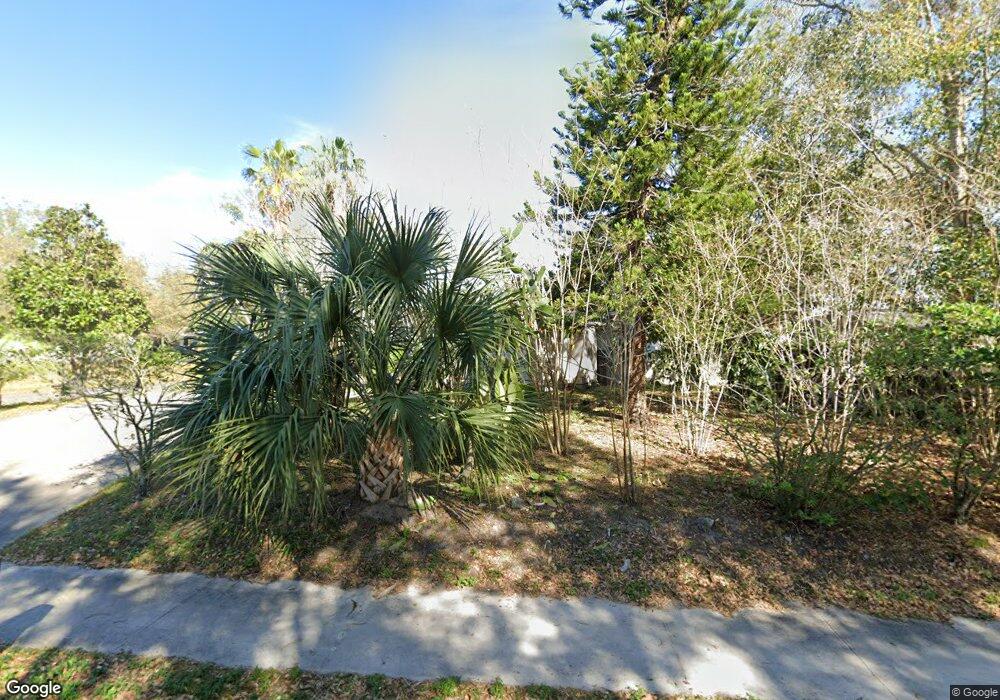
103 S Aurora Dr Apopka, FL 32703
Estimated Value: $261,000 - $280,365
3
Beds
1
Bath
1,440
Sq Ft
$190/Sq Ft
Est. Value
About This Home
This home is located at 103 S Aurora Dr, Apopka, FL 32703 and is currently estimated at $273,841, approximately $190 per square foot. 103 S Aurora Dr is a home located in Orange County with nearby schools including Clay Springs Elementary School, Piedmont Lakes Middle School, and Wekiva High School.
Ownership History
Date
Name
Owned For
Owner Type
Purchase Details
Closed on
Mar 2, 2022
Sold by
Marisela Vladez
Bought by
Diamon Realty Investments Corp
Current Estimated Value
Purchase Details
Closed on
May 28, 2009
Sold by
Citibank Na
Bought by
Valdez Fermin Robledo and Valdez Marisela
Purchase Details
Closed on
Dec 10, 2008
Sold by
Rojas Serafin M and Mortgage Electronic Registrati
Bought by
Citibank Na and The Mlmi Trust Series 2007-He2
Purchase Details
Closed on
Nov 27, 2006
Sold by
Pauna Zamfira and Pauna Zamfiro
Bought by
Rojas Serafin M
Home Financials for this Owner
Home Financials are based on the most recent Mortgage that was taken out on this home.
Original Mortgage
$39,000
Interest Rate
6.29%
Mortgage Type
Stand Alone Second
Create a Home Valuation Report for This Property
The Home Valuation Report is an in-depth analysis detailing your home's value as well as a comparison with similar homes in the area
Home Values in the Area
Average Home Value in this Area
Purchase History
| Date | Buyer | Sale Price | Title Company |
|---|---|---|---|
| Diamon Realty Investments Corp | -- | None Listed On Document | |
| Valdez Fermin Robledo | $55,000 | Attorney | |
| Citibank Na | -- | None Available | |
| Rojas Serafin M | $195,000 | Palm State Title Of Fl Llc |
Source: Public Records
Mortgage History
| Date | Status | Borrower | Loan Amount |
|---|---|---|---|
| Previous Owner | Rojas Serafin M | $39,000 | |
| Previous Owner | Rojas Serafin M | $156,000 |
Source: Public Records
Tax History Compared to Growth
Tax History
| Year | Tax Paid | Tax Assessment Tax Assessment Total Assessment is a certain percentage of the fair market value that is determined by local assessors to be the total taxable value of land and additions on the property. | Land | Improvement |
|---|---|---|---|---|
| 2025 | $4,067 | $238,370 | $72,000 | $166,370 |
| 2024 | $3,727 | $230,390 | $72,000 | $158,390 |
| 2023 | $3,727 | $218,715 | $72,000 | $146,715 |
| 2022 | $3,016 | $183,510 | $60,000 | $123,510 |
| 2021 | $2,720 | $153,475 | $45,000 | $108,475 |
| 2020 | $2,661 | $139,471 | $35,000 | $104,471 |
| 2019 | $2,267 | $125,668 | $35,000 | $90,668 |
| 2018 | $230 | $65,961 | $0 | $0 |
| 2017 | $220 | $109,411 | $30,000 | $79,411 |
| 2016 | $200 | $91,897 | $18,000 | $73,897 |
| 2015 | $200 | $87,546 | $18,000 | $69,546 |
| 2014 | $235 | $72,912 | $18,000 | $54,912 |
Source: Public Records
Map
Nearby Homes
- 17 S Aurora Dr
- 14 Cyclops Dr
- 2031 Wekiva Reserve Blvd
- 111 N Atlas Dr
- 1816 Pegasus Dr
- 2217 Wekiva Reserve Blvd
- 2242 Wekiva Reserve Blvd
- 224 Copper Oak Ct
- 215 Bronze Leaf Ct
- 2421 Cimmaron Ash Way
- 2519 Walnut Heights Rd
- 2474 Cimmaron Ash Way
- 2343 Walnut Heights Rd
- 2486 Cimmaron Ash Way
- 2607 E Semoran Blvd
- 2434 Walnut Heights Rd
- 2615 E Semoran Blvd
- 2251 Wekiva Village Ln
- 1532 E Semoran Blvd
- 1801 Bent Oak Ct
- 107 S Aurora Dr
- 2004 Athens Ct
- 111 S Aurora Dr
- 2008 Athens Ct
- 2005 Athens Ct
- 104 S Aurora Dr
- 108 S Aurora Dr
- 115 S Aurora Dr
- 18 S Aurora Dr
- 13 S Aurora Dr
- 2009 Athens Ct
- 112 S Aurora Dr
- 2012 Athens Ct
- 14 S Aurora Dr
- 22 Cyclops Dr
- 119 S Aurora Dr
- 9 S Aurora Dr
- 116 S Aurora Dr
- 105 S Atlas Dr
- 10 S Aurora Dr