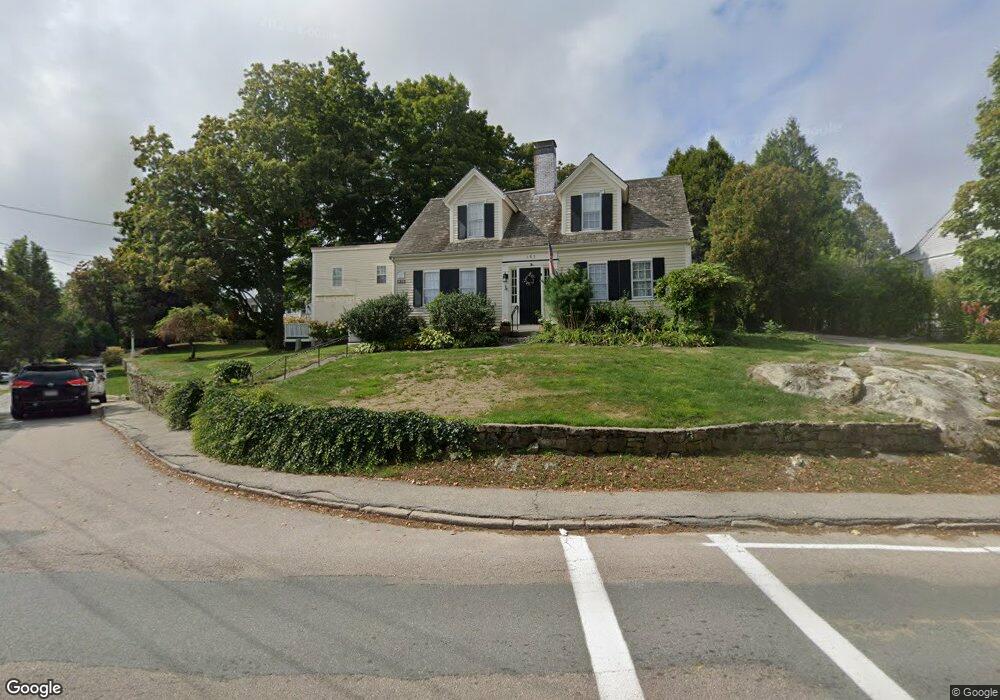
103 S Main St Cohasset, MA 02025
Estimated Value: $1,204,389 - $1,882,000
4
Beds
3
Baths
2,324
Sq Ft
$699/Sq Ft
Est. Value
About This Home
This home is located at 103 S Main St, Cohasset, MA 02025 and is currently estimated at $1,624,347, approximately $698 per square foot. 103 S Main St is a home located in Norfolk County with nearby schools including Joseph Osgood School, Deer Hill School, and Cohasset Middle School.
Ownership History
Date
Name
Owned For
Owner Type
Purchase Details
Closed on
Apr 16, 1997
Sold by
Wade Peter G
Bought by
Mccarthy George M and Mccarthy Katherine M
Current Estimated Value
Purchase Details
Closed on
May 2, 1996
Sold by
Est Tessahog Rt and Wade Peter G
Bought by
Wade Peter G
Purchase Details
Closed on
Jan 27, 1992
Sold by
Est Bunstein Richard A
Bought by
Tessahoc Rt
Create a Home Valuation Report for This Property
The Home Valuation Report is an in-depth analysis detailing your home's value as well as a comparison with similar homes in the area
Home Values in the Area
Average Home Value in this Area
Purchase History
| Date | Buyer | Sale Price | Title Company |
|---|---|---|---|
| Mccarthy George M | $300,000 | -- | |
| Mccarthy George M | $300,000 | -- | |
| Wade Peter G | $80,000 | -- | |
| Wade Peter G | $80,000 | -- | |
| Tessahoc Rt | $97,000 | -- | |
| Tessahoc Rt | $97,000 | -- |
Source: Public Records
Mortgage History
| Date | Status | Borrower | Loan Amount |
|---|---|---|---|
| Open | Tessahoc Rt | $608,000 | |
| Closed | Tessahoc Rt | $483,000 |
Source: Public Records
Tax History Compared to Growth
Tax History
| Year | Tax Paid | Tax Assessment Tax Assessment Total Assessment is a certain percentage of the fair market value that is determined by local assessors to be the total taxable value of land and additions on the property. | Land | Improvement |
|---|---|---|---|---|
| 2025 | $9,877 | $852,900 | $474,200 | $378,700 |
| 2024 | $9,158 | $752,500 | $379,400 | $373,100 |
| 2023 | $8,869 | $751,600 | $379,200 | $372,400 |
| 2022 | $8,970 | $714,200 | $379,200 | $335,000 |
| 2021 | $8,419 | $645,600 | $344,000 | $301,600 |
| 2020 | $8,373 | $645,600 | $344,000 | $301,600 |
| 2019 | $8,328 | $645,600 | $344,000 | $301,600 |
| 2018 | $8,257 | $645,600 | $344,000 | $301,600 |
| 2017 | $7,626 | $583,900 | $312,800 | $271,100 |
| 2016 | $7,521 | $583,900 | $312,800 | $271,100 |
| 2015 | $7,421 | $583,900 | $312,800 | $271,100 |
| 2014 | $7,322 | $583,900 | $312,800 | $271,100 |
Source: Public Records
Map
Nearby Homes
- 128 Elm St Unit 211
- 87 Elm St Unit 215
- 18 Pleasant St
- 21-23 Elm Ct
- 26 Ash St
- 124 Elm St Unit 202
- 124 Elm St Unit 308
- 4 Margin St Unit A
- 40 Pond St
- 15 Cushing Rd
- 89 Ripley Rd
- 98 Black Horse Ln
- 212 S Main St
- 30 Black Horse Ln
- 73 Pond St
- 11 Beach St
- 68 Black Horse Ln
- 245 S Main St
- 70 Black Horse Ln
- 100 Pond St Unit 10
- 95 S Main St
- 95 S Main St Unit 1
- 99 F S Main St Unit Front
- 99 S Main St Unit R
- 99 S Main St Unit F
- 99 S Main St
- 99 S Main St Unit Front
- 99 S Main St Unit 1&2
- 99 S Main St Unit F&R
- 109 S Main St
- 106 S Main St Unit 1
- 106 S Main St Unit 110
- 106 S Main St
- 7 Spring St
- 91 S Main St
- 98 S Main St
- 88 S Main St
- 93 S Main St
- 76 S Main St Unit 1
- 76 S Main St