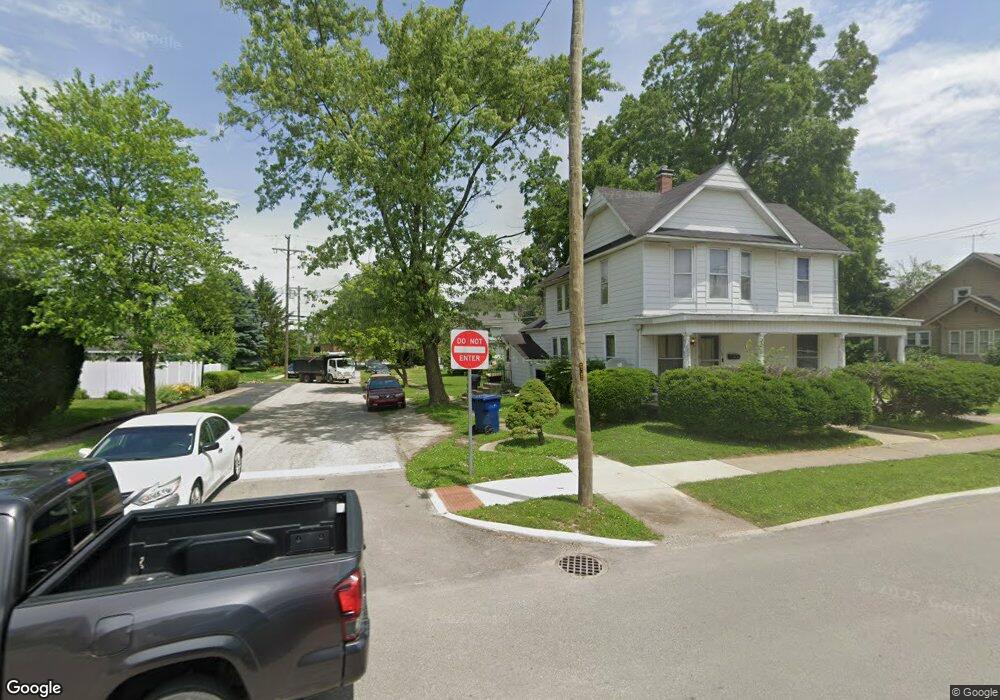
103 S Ohio St Sheridan, IN 46069
Estimated Value: $238,000 - $288,000
4
Beds
3
Baths
2,536
Sq Ft
$103/Sq Ft
Est. Value
About This Home
This home is located at 103 S Ohio St, Sheridan, IN 46069 and is currently estimated at $261,331, approximately $103 per square foot. 103 S Ohio St is a home located in Hamilton County with nearby schools including Sheridan Elementary School, Sheridan Middle School, and Sheridan High School.
Ownership History
Date
Name
Owned For
Owner Type
Purchase Details
Closed on
Nov 30, 2007
Sold by
Inman Shirley A and Schoen Vicki L
Bought by
Paloncy Nicole R
Current Estimated Value
Home Financials for this Owner
Home Financials are based on the most recent Mortgage that was taken out on this home.
Original Mortgage
$91,000
Interest Rate
5.95%
Mortgage Type
Purchase Money Mortgage
Purchase Details
Closed on
Oct 3, 2002
Sold by
Inman Shirley A
Bought by
Inman Shirley A and Schoen Vicki L
Create a Home Valuation Report for This Property
The Home Valuation Report is an in-depth analysis detailing your home's value as well as a comparison with similar homes in the area
Home Values in the Area
Average Home Value in this Area
Purchase History
| Date | Buyer | Sale Price | Title Company |
|---|---|---|---|
| Paloncy Nicole R | -- | None Available | |
| Inman Shirley A | -- | -- |
Source: Public Records
Mortgage History
| Date | Status | Borrower | Loan Amount |
|---|---|---|---|
| Previous Owner | Paloncy Nicole R | $91,000 |
Source: Public Records
Tax History Compared to Growth
Tax History
| Year | Tax Paid | Tax Assessment Tax Assessment Total Assessment is a certain percentage of the fair market value that is determined by local assessors to be the total taxable value of land and additions on the property. | Land | Improvement |
|---|---|---|---|---|
| 2024 | $3,258 | $148,700 | $36,300 | $112,400 |
| 2023 | $3,283 | $144,800 | $36,300 | $108,500 |
| 2022 | $3,053 | $133,000 | $36,300 | $96,700 |
| 2021 | $1,430 | $124,800 | $36,300 | $88,500 |
| 2020 | $1,346 | $117,600 | $36,300 | $81,300 |
| 2019 | $1,293 | $113,000 | $15,200 | $97,800 |
| 2018 | $1,209 | $105,800 | $15,200 | $90,600 |
| 2017 | $1,053 | $97,200 | $15,200 | $82,000 |
| 2016 | $1,149 | $104,100 | $15,200 | $88,900 |
| 2014 | $735 | $82,100 | $21,800 | $60,300 |
| 2013 | $735 | $89,800 | $21,800 | $68,000 |
Source: Public Records
Map
Nearby Homes
- 206 S Ohio St
- 390 W State Road 38
- 400 S Georgia St
- 405 W 3rd St
- 707 S Hamilton Ave
- 600 S Georgia St
- 514 E 2nd St
- 103 S Hudson St
- Holcombe Plan at Centre Place
- Aldridge Plan at Centre Place
- Harmony Plan at Centre Place
- Henley Plan at Centre Place
- Chatham Plan at Centre Place
- Stamford Plan at Centre Place
- 3310 Godby Dr
- 3310 Godby St
- 3352 Godby Dr
- 3369 Godby St
- 3328 Godby Dr
- 3375 Godby Dr