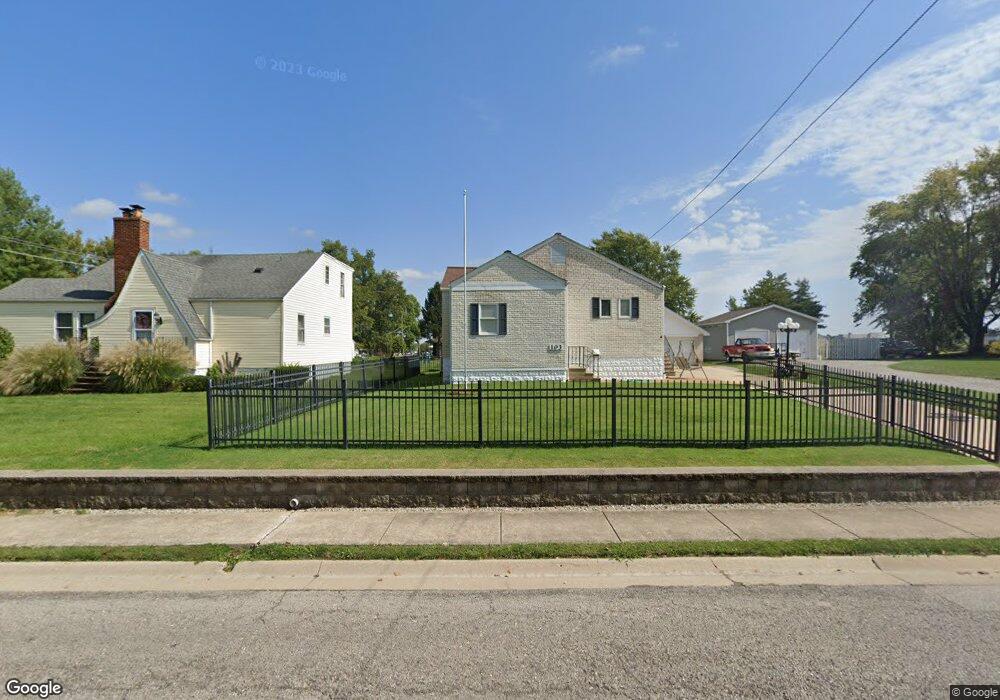
103 S Ruby Ln Fairview Heights, IL 62208
Estimated Value: $132,436 - $146,000
Studio
--
Bath
900
Sq Ft
$156/Sq Ft
Est. Value
About This Home
This home is located at 103 S Ruby Ln, Fairview Heights, IL 62208 and is currently estimated at $140,359, approximately $155 per square foot. 103 S Ruby Ln is a home located in St. Clair County with nearby schools including William Holliday Elementary School, Pontiac William Holliday Jr High School, and Holy Trinity Catholic School.
Ownership History
Date
Name
Owned For
Owner Type
Purchase Details
Closed on
Oct 27, 2011
Sold by
Hurst Daniel E
Bought by
Hurst Daniel E and Daniel E Hurst Declaration Of Trust
Current Estimated Value
Purchase Details
Closed on
Oct 13, 2011
Sold by
Hurst Daniel E
Bought by
Hurst Daniel E
Purchase Details
Closed on
Nov 19, 2008
Sold by
Hurst Jack E
Bought by
Hurst Jack E and Jack E Hurst Declaration Of Trust
Purchase Details
Closed on
Jun 2, 2008
Sold by
Hurst Jack E and Hurst Betty J
Bought by
Hurst Jack E and Hurst Betty J
Create a Home Valuation Report for This Property
The Home Valuation Report is an in-depth analysis detailing your home's value as well as a comparison with similar homes in the area
Home Values in the Area
Average Home Value in this Area
Purchase History
| Date | Buyer | Sale Price | Title Company |
|---|---|---|---|
| Hurst Daniel E | -- | None Available | |
| Hurst Daniel E | -- | None Available | |
| Hurst Jack E | -- | None Available | |
| Hurst Jack E | -- | None Available |
Source: Public Records
Tax History
| Year | Tax Paid | Tax Assessment Tax Assessment Total Assessment is a certain percentage of the fair market value that is determined by local assessors to be the total taxable value of land and additions on the property. | Land | Improvement |
|---|---|---|---|---|
| 2024 | $2,345 | $42,325 | $3,708 | $38,617 |
| 2023 | $2,127 | $37,449 | $3,281 | $34,168 |
| 2022 | $2,038 | $35,555 | $3,216 | $32,339 |
| 2021 | $1,965 | $33,746 | $3,052 | $30,694 |
| 2020 | $1,931 | $31,966 | $2,891 | $29,075 |
| 2019 | $1,851 | $31,966 | $2,891 | $29,075 |
| 2018 | $1,798 | $30,617 | $3,092 | $27,525 |
| 2017 | $870 | $29,374 | $2,966 | $26,408 |
| 2016 | $1,708 | $28,711 | $2,899 | $25,812 |
| 2014 | -- | $29,479 | $4,558 | $24,921 |
| 2013 | $1,077 | $30,022 | $4,642 | $25,380 |
Source: Public Records
Map
Nearby Homes
Your Personal Tour Guide
Ask me questions while you tour the home.