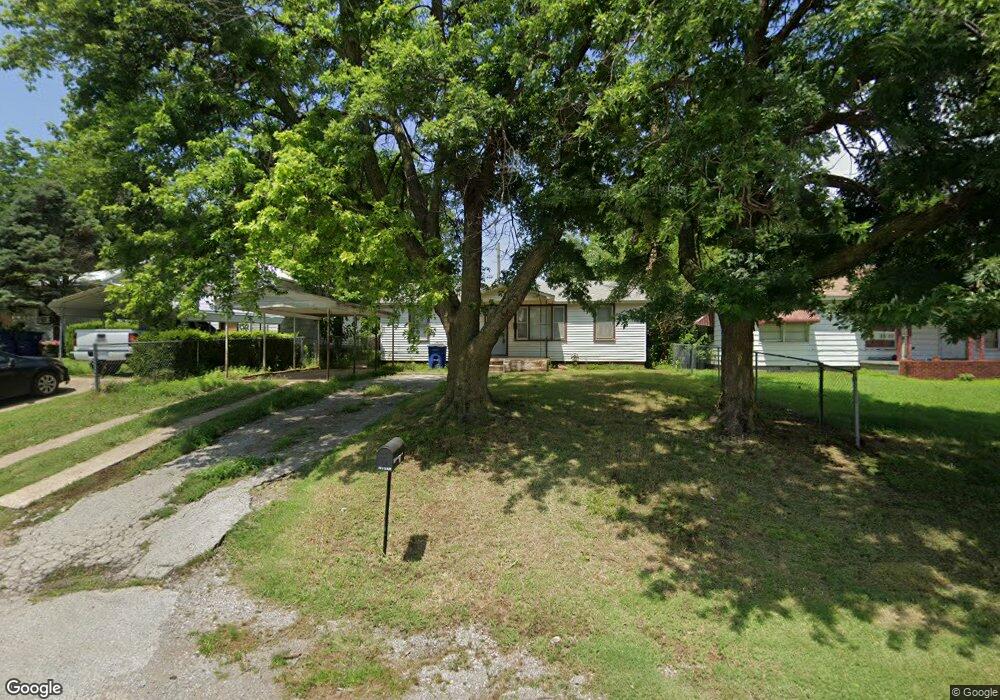
103 S Walnut St Marlow, OK 73055
Estimated Value: $83,000 - $100,000
3
Beds
1
Bath
1,368
Sq Ft
$65/Sq Ft
Est. Value
About This Home
This home is located at 103 S Walnut St, Marlow, OK 73055 and is currently estimated at $88,759, approximately $64 per square foot. 103 S Walnut St is a home located in Stephens County with nearby schools including Marlow Elementary School, Marlow Middle School, and Marlow High School.
Ownership History
Date
Name
Owned For
Owner Type
Purchase Details
Closed on
Apr 22, 2014
Sold by
Riley Ricky I and Riley Coriene M
Bought by
Riley Ricky I and Riley Coriene M
Current Estimated Value
Home Financials for this Owner
Home Financials are based on the most recent Mortgage that was taken out on this home.
Original Mortgage
$44,982
Outstanding Balance
$13,535
Interest Rate
4.34%
Mortgage Type
Purchase Money Mortgage
Estimated Equity
$75,224
Purchase Details
Closed on
Dec 30, 2013
Sold by
M16s Lp
Bought by
Riley Coriene and Riley Ricky
Purchase Details
Closed on
Aug 30, 2011
Sold by
Wells Fargo Bank Na
Bought by
M 16 S Lp
Purchase Details
Closed on
Mar 13, 2007
Sold by
Shelton Curtis R and Shelton Danetta D
Bought by
Cox Jeffery Dale
Home Financials for this Owner
Home Financials are based on the most recent Mortgage that was taken out on this home.
Original Mortgage
$63,000
Interest Rate
12.3%
Mortgage Type
Adjustable Rate Mortgage/ARM
Create a Home Valuation Report for This Property
The Home Valuation Report is an in-depth analysis detailing your home's value as well as a comparison with similar homes in the area
Home Values in the Area
Average Home Value in this Area
Purchase History
| Date | Buyer | Sale Price | Title Company |
|---|---|---|---|
| Riley Ricky I | -- | None Available | |
| Riley Coriene | $18,250 | None Available | |
| M 16 S Lp | $12,000 | None Available | |
| Cox Jeffery Dale | $70,000 | Nations Title |
Source: Public Records
Mortgage History
| Date | Status | Borrower | Loan Amount |
|---|---|---|---|
| Open | Riley Ricky I | $44,982 | |
| Previous Owner | Cox Jeffery Dale | $63,000 |
Source: Public Records
Tax History Compared to Growth
Tax History
| Year | Tax Paid | Tax Assessment Tax Assessment Total Assessment is a certain percentage of the fair market value that is determined by local assessors to be the total taxable value of land and additions on the property. | Land | Improvement |
|---|---|---|---|---|
| 2024 | $344 | $3,359 | $441 | $2,918 |
| 2023 | $344 | $3,359 | $447 | $2,912 |
| 2022 | $312 | $3,199 | $415 | $2,784 |
| 2021 | $275 | $3,047 | $390 | $2,657 |
| 2020 | $258 | $2,764 | $335 | $2,429 |
| 2019 | $245 | $2,632 | $301 | $2,331 |
| 2018 | $231 | $2,632 | $271 | $2,361 |
| 2017 | $220 | $2,507 | $271 | $2,236 |
| 2016 | $209 | $2,274 | $271 | $2,003 |
| 2015 | $230 | $2,274 | $271 | $2,003 |
| 2014 | $230 | $2,274 | $271 | $2,003 |
Source: Public Records
Map
Nearby Homes
- 503, 505, 507 E Main St
- 212 212 S Broadway St
- 106 E Cheyenne Ave
- 416 St
- 0 E Nabor Ave
- 208 W Apache St
- 602 S 2nd St
- 407 407 W Main
- 404 S 4th St
- 506 N Broadway St
- 511 511 S Broadway St
- 605 605 N Ash
- 405 S 5th St
- 1007 S Broadway St
- 801 801 N 4th St
- 511 W Steele St
- 701 W McNeese St
- 111 E Memorial
- 1008 Gary Place
- Lot 5 W Jarboe Ave
- 105 S Walnut St
- 101 101 S Walnut
- 101 S Walnut St
- 107 S Walnut St
- 302 E Main St
- 109 E Seminole St
- 209 E Seminole St
- 111 S Walnut St
- 110 S Walnut St
- 211 E Main St
- 107 E Seminole St
- 205 E Seminole St
- 205 E Main St
- 205 205 E Seminole St
- 301 E Main St
- 112 St
- 318 E Main St
- 208 E Seminole St
- 112 E Seminole St
- 108 E Seminole St