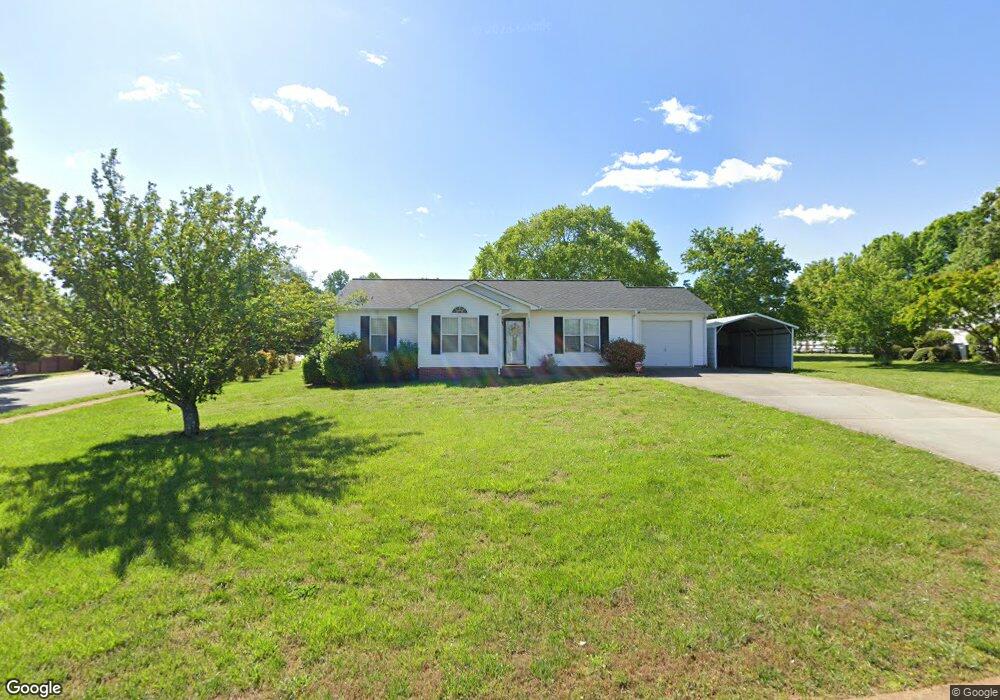
103 Shenandoah Loop Troutman, NC 28166
Estimated Value: $292,419 - $312,000
3
Beds
2
Baths
1,125
Sq Ft
$267/Sq Ft
Est. Value
About This Home
This home is located at 103 Shenandoah Loop, Troutman, NC 28166 and is currently estimated at $300,605, approximately $267 per square foot. 103 Shenandoah Loop is a home located in Iredell County with nearby schools including Troutman Elementary School, Troutman Middle School, and South Iredell High School.
Ownership History
Date
Name
Owned For
Owner Type
Purchase Details
Closed on
Jan 28, 2016
Sold by
Barger Larry Vernon and Barger Sharon Jhonson
Bought by
Stanley Bethany W
Current Estimated Value
Home Financials for this Owner
Home Financials are based on the most recent Mortgage that was taken out on this home.
Original Mortgage
$97,750
Outstanding Balance
$59,273
Interest Rate
3.99%
Mortgage Type
New Conventional
Estimated Equity
$241,332
Purchase Details
Closed on
Aug 29, 2007
Sold by
Biondo David M
Bought by
Barger Larry
Home Financials for this Owner
Home Financials are based on the most recent Mortgage that was taken out on this home.
Original Mortgage
$110,000
Interest Rate
6.7%
Mortgage Type
Purchase Money Mortgage
Purchase Details
Closed on
Aug 28, 2002
Sold by
Spear Investments Llc
Bought by
Biondo David M
Home Financials for this Owner
Home Financials are based on the most recent Mortgage that was taken out on this home.
Original Mortgage
$109,038
Interest Rate
6.49%
Mortgage Type
FHA
Create a Home Valuation Report for This Property
The Home Valuation Report is an in-depth analysis detailing your home's value as well as a comparison with similar homes in the area
Home Values in the Area
Average Home Value in this Area
Purchase History
| Date | Buyer | Sale Price | Title Company |
|---|---|---|---|
| Stanley Bethany W | $128,000 | None Available | |
| Barger Larry | $110,000 | None Available | |
| Biondo David M | $110,000 | -- |
Source: Public Records
Mortgage History
| Date | Status | Borrower | Loan Amount |
|---|---|---|---|
| Open | Stanley Bethany W | $97,750 | |
| Previous Owner | Barger Larry | $110,000 | |
| Previous Owner | Biondo David M | $109,038 |
Source: Public Records
Tax History
| Year | Tax Paid | Tax Assessment Tax Assessment Total Assessment is a certain percentage of the fair market value that is determined by local assessors to be the total taxable value of land and additions on the property. | Land | Improvement |
|---|---|---|---|---|
| 2025 | $1,591 | $255,100 | $45,000 | $210,100 |
| 2024 | $1,657 | $255,100 | $45,000 | $210,100 |
| 2023 | $1,591 | $255,100 | $45,000 | $210,100 |
| 2022 | $890 | $132,950 | $28,000 | $104,950 |
| 2021 | $890 | $132,950 | $28,000 | $104,950 |
| 2020 | $890 | $132,950 | $28,000 | $104,950 |
| 2019 | $857 | $132,950 | $28,000 | $104,950 |
| 2018 | $737 | $114,670 | $28,000 | $86,670 |
| 2017 | $737 | $114,670 | $28,000 | $86,670 |
| 2016 | $737 | $114,670 | $28,000 | $86,670 |
| 2015 | $737 | $114,670 | $28,000 | $86,670 |
| 2014 | $644 | $107,630 | $23,000 | $84,630 |
Source: Public Records
Map
Nearby Homes
- 126 Meadow Glen Dr
- 115 Park Vista Dr
- 122 Valley Glen Dr
- 125 Crestview Ln Unit 14
- 133 Crestview Ln Unit 15
- 161 Fernview Trail Unit 9
- 170 Meadow Glen Dr
- 140 Meadowfall Ln
- 270 Spicewood Cir
- 229 Shenandoah Loop
- 141 Winding Creek Dr
- 187 Winding Creek Dr
- 137 Falls Cove Dr
- 156 Ashmore Cir
- 175 Falls Cove Dr
- 164 N Hill Ln
- 159 Calvin Creek Dr
- 712 Georgie St
- 215 Streamwood Rd
- 155 Streamwood Rd
- 105 Shenandoah Loop Unit 106
- L113 Meadow Glen Dr
- L115 Meadow Glen Dr
- L117 Meadow Glen Dr
- 45LT Shenandoah Loop
- L 45 Shenandoah Loop
- L91 Shenandoah Loop
- L93 Shenandoah Loop
- L31-33 Shenandoah Loop
- 31-33 Shenandoah Loop Unit 31-33
- L105 Shenandoah Loop
- 113 Meadow Glen Dr Unit 113
- 115 Meadow Glen Dr Unit 115
- L107 Shenandoah Loop
- 117 Meadow Glen Dr Unit 117
- 109 Shenandoah Loop
- 92 Shenandoah Loop
- 91 Shenandoah Loop
- 93 Shenandoah Loop
- 91 Shenandoah Loop Unit 91
Your Personal Tour Guide
Ask me questions while you tour the home.