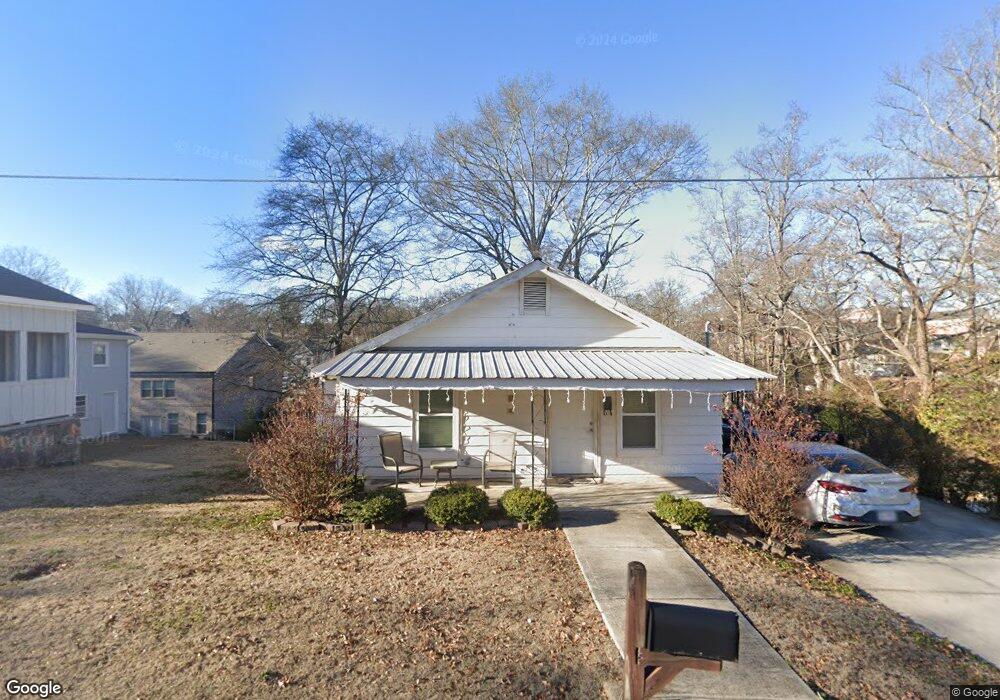
103 South St Buford, GA 30518
Estimated Value: $239,790 - $313,000
1
Bed
1
Bath
876
Sq Ft
$308/Sq Ft
Est. Value
About This Home
This home is located at 103 South St, Buford, GA 30518 and is currently estimated at $270,198, approximately $308 per square foot. 103 South St is a home located in Gwinnett County with nearby schools including Buford Elementary School, Buford Senior Academy, and Buford Academy.
Ownership History
Date
Name
Owned For
Owner Type
Purchase Details
Closed on
Aug 24, 2017
Sold by
Naquin Stephen
Bought by
Naquin Cameron
Current Estimated Value
Purchase Details
Closed on
Aug 1, 2011
Sold by
Osborne Kenneth
Bought by
Naquin Stephen
Purchase Details
Closed on
Feb 17, 2011
Sold by
Federal Home Loan Mortgage Corporation
Bought by
Naquin Stephen
Purchase Details
Closed on
Oct 5, 2010
Sold by
Everhome Mtg Co
Bought by
Federal Home Loan Mortgage Corporation
Purchase Details
Closed on
Aug 11, 2006
Sold by
Mote David M and Mote Martha J
Bought by
Charlton Kenneth R
Home Financials for this Owner
Home Financials are based on the most recent Mortgage that was taken out on this home.
Original Mortgage
$70,650
Interest Rate
6.75%
Mortgage Type
New Conventional
Purchase Details
Closed on
May 26, 2006
Sold by
Freeman Jessie B
Bought by
Mote David M and Mote Martha J
Create a Home Valuation Report for This Property
The Home Valuation Report is an in-depth analysis detailing your home's value as well as a comparison with similar homes in the area
Home Values in the Area
Average Home Value in this Area
Purchase History
| Date | Buyer | Sale Price | Title Company |
|---|---|---|---|
| Naquin Cameron | -- | -- | |
| Naquin Stephen | -- | -- | |
| Naquin Stephen | -- | -- | |
| Federal Home Loan Mortgage Corporation | -- | -- | |
| Everhome Mtg Co | $67,500 | -- | |
| Charlton Kenneth R | $78,500 | -- | |
| Mote David M | -- | -- |
Source: Public Records
Mortgage History
| Date | Status | Borrower | Loan Amount |
|---|---|---|---|
| Previous Owner | Charlton Kenneth R | $70,650 |
Source: Public Records
Tax History Compared to Growth
Tax History
| Year | Tax Paid | Tax Assessment Tax Assessment Total Assessment is a certain percentage of the fair market value that is determined by local assessors to be the total taxable value of land and additions on the property. | Land | Improvement |
|---|---|---|---|---|
| 2025 | $903 | $62,960 | $40,000 | $22,960 |
| 2024 | $830 | $57,840 | $33,600 | $24,240 |
| 2023 | $830 | $45,080 | $26,000 | $19,080 |
| 2022 | $647 | $45,080 | $26,000 | $19,080 |
| 2021 | $400 | $27,880 | $16,800 | $11,080 |
| 2020 | $400 | $27,880 | $16,800 | $11,080 |
| 2019 | $361 | $27,880 | $16,800 | $11,080 |
| 2018 | $237 | $18,280 | $5,600 | $12,680 |
| 2016 | $234 | $18,280 | $5,600 | $12,680 |
| 2015 | $243 | $18,280 | $5,600 | $12,680 |
| 2014 | $124 | $9,200 | $5,600 | $3,600 |
Source: Public Records
Map
Nearby Homes
- 129 South St
- 130 South St
- 260 N Alexander St
- 337 S Alexander St
- S S Alexander St
- 140 South St
- 220 N Alexander St
- 300 S Alexander St
- 284 Church St
- 360 S Alexander St
- 350 S Alexander St
- 274 S Church St
- 274 Church St
- 320 Church St
- 90 W Park St
- 234 S Church St
- 254 Church St
- 357 S Alexander St
- 80 W Park St
- 340 Church St