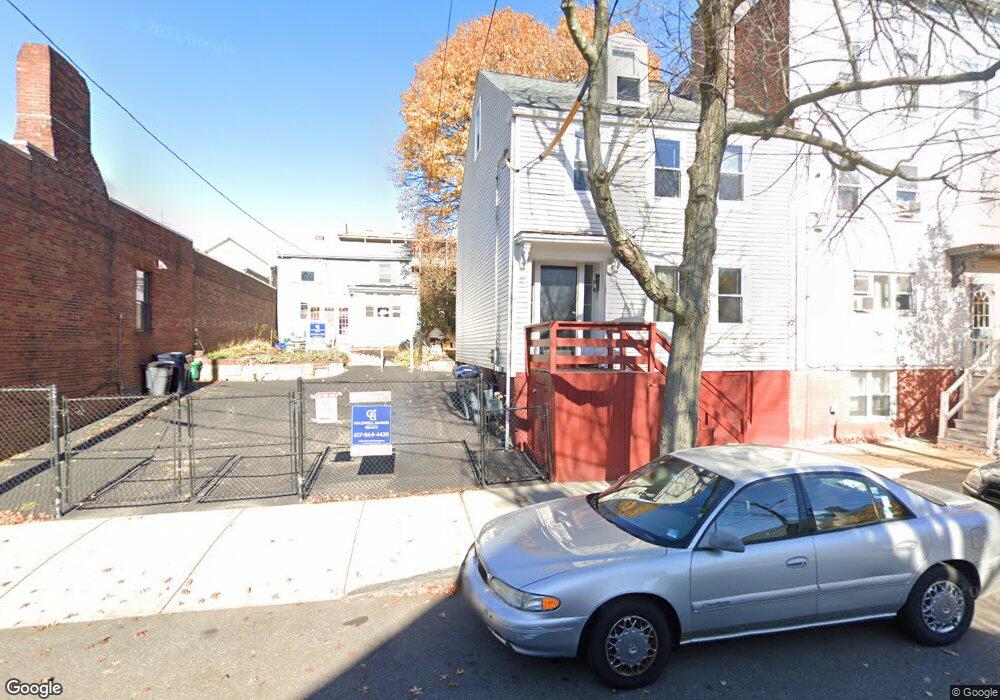
103 Spring St Cambridge, MA 02141
East Cambridge NeighborhoodEstimated Value: $1,096,000 - $1,310,000
2
Beds
1
Bath
1,206
Sq Ft
$969/Sq Ft
Est. Value
About This Home
This home is located at 103 Spring St, Cambridge, MA 02141 and is currently estimated at $1,169,176, approximately $969 per square foot. 103 Spring St is a home located in Middlesex County with nearby schools including Community Charter School of Cambridge, Boston Children's School, and Torit Montessori School.
Ownership History
Date
Name
Owned For
Owner Type
Purchase Details
Closed on
Nov 5, 2010
Sold by
Ford Mary Margaret
Bought by
Ford Mary Margaret and Elbag Nancy
Current Estimated Value
Purchase Details
Closed on
Sep 16, 1985
Bought by
Ford Mary Margaret
Create a Home Valuation Report for This Property
The Home Valuation Report is an in-depth analysis detailing your home's value as well as a comparison with similar homes in the area
Home Values in the Area
Average Home Value in this Area
Purchase History
| Date | Buyer | Sale Price | Title Company |
|---|---|---|---|
| Ford Mary Margaret | -- | -- | |
| Ford Mary Margaret | -- | -- |
Source: Public Records
Mortgage History
| Date | Status | Borrower | Loan Amount |
|---|---|---|---|
| Previous Owner | Ford Mary Margaret | $40,000 | |
| Previous Owner | Ford Mary Margaret | $45,000 |
Source: Public Records
Tax History
| Year | Tax Paid | Tax Assessment Tax Assessment Total Assessment is a certain percentage of the fair market value that is determined by local assessors to be the total taxable value of land and additions on the property. | Land | Improvement |
|---|---|---|---|---|
| 2025 | $5,929 | $933,700 | $647,900 | $285,800 |
| 2024 | $5,727 | $967,400 | $693,800 | $273,600 |
| 2023 | $5,268 | $898,900 | $662,400 | $236,500 |
| 2022 | $5,127 | $866,100 | $656,800 | $209,300 |
| 2021 | $4,908 | $839,000 | $644,500 | $194,500 |
| 2020 | $4,800 | $834,800 | $650,500 | $184,300 |
| 2019 | $4,989 | $839,900 | $638,100 | $201,800 |
| 2018 | $4,539 | $721,600 | $529,100 | $192,500 |
| 2017 | $4,238 | $653,000 | $473,100 | $179,900 |
| 2016 | $3,752 | $536,800 | $370,400 | $166,400 |
| 2015 | $3,645 | $466,100 | $317,500 | $148,600 |
| 2014 | $3,288 | $392,400 | $245,900 | $146,500 |
Source: Public Records
Map
Nearby Homes
- 104 Thorndike St Unit 2
- 76-78 Thorndike St
- 259 Hurley St Unit 4
- 241 Hurley St Unit 1
- 78 Otis St
- 303 Hurley St
- 66 6th St Unit 3
- 66 6th St Unit 2
- 93 Third St
- 101 Third St Unit 2
- 50 Spring St
- 59 7th St
- 59 7th St Unit 2
- 59 7th St Unit 1
- 59 7th St Unit 3
- 3 Mullins Ct Unit 3
- 57 Hurley St Unit 3
- 95 2nd St Unit 3
- 47-53R 8th St
- 30
- 101 Spring St
- 101 Spring St Unit 1
- 101 Spring St Unit 2
- 99 Spring St
- 10 Fourth St Place Unit 1
- 97 Spring St Unit 2
- 97 Spring St Unit 1
- 97 Spring St
- 97-2 Spring St Unit 97-2
- 106 Thorndike St
- 104 Thorndike St
- 104 Thorndike St Unit 2B3
- 104 Thorndike St
- 104 Thorndike St Unit 3
- 138+ 140 140a B C Spring St
- 102 Thorndike St
- 95 Spring St Unit 1
- 95 Spring St
- 110 Thorndike St
- 110 Thorndike St Unit 1F
Your Personal Tour Guide
Ask me questions while you tour the home.