103 Spring St Cambridge, MA 02141
East Cambridge NeighborhoodEstimated Value: $997,000 - $1,183,000
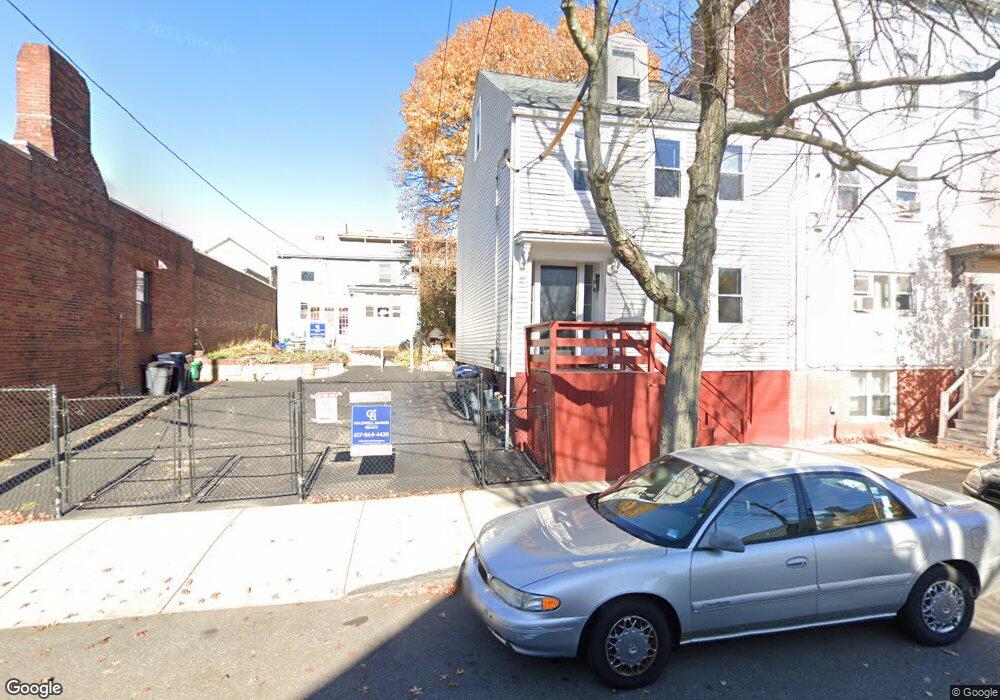
About This Home
This home is located at 103 Spring St, Cambridge, MA 02141 and is currently estimated at $1,107,676, approximately $918 per square foot. 103 Spring St is a home located in Middlesex County with nearby schools including Community Charter School of Cambridge, Boston Children's School, and Torit Montessori School.
Ownership History
We collect this data history from publicly available records. To have your information removed, we recommend requesting removal directly through your county’s website.
Purchase Details
Purchase Details
Home Values in the Area
Average Home Value in this Area
Purchase History
We collect this data history from publicly available records. To have your information removed, we recommend requesting removal directly through your county’s website.
| Date | Buyer | Sale Price | Title Company |
|---|---|---|---|
| -- | -- | ||
| -- | -- |
Mortgage History
We collect this data history from publicly available records. To have your information removed, we recommend requesting removal directly through your county’s website.
| Date | Status | Borrower | Loan Amount |
|---|---|---|---|
| Previous Owner | $40,000 | ||
| Previous Owner | $45,000 |
Tax History
We collect this data history from publicly available records. To have your information removed, we recommend requesting removal directly through your county’s website.
| Year | Tax Paid | Tax Assessment Tax Assessment Total Assessment is a certain percentage of the fair market value that is determined by local assessors to be the total taxable value of land and additions on the property. | Land | Improvement |
|---|---|---|---|---|
| 2025 | $5,929 | $933,700 | $647,900 | $285,800 |
| 2024 | $5,727 | $967,400 | $693,800 | $273,600 |
| 2023 | $5,268 | $898,900 | $662,400 | $236,500 |
| 2022 | $5,127 | $866,100 | $656,800 | $209,300 |
| 2021 | $4,908 | $839,000 | $644,500 | $194,500 |
| 2020 | $4,800 | $834,800 | $650,500 | $184,300 |
| 2019 | $4,989 | $839,900 | $638,100 | $201,800 |
| 2018 | $4,539 | $721,600 | $529,100 | $192,500 |
| 2017 | $4,238 | $653,000 | $473,100 | $179,900 |
| 2016 | $3,752 | $536,800 | $370,400 | $166,400 |
| 2015 | $3,645 | $466,100 | $317,500 | $148,600 |
| 2014 | $3,288 | $392,400 | $245,900 | $146,500 |
Map
- 104 Thorndike St Unit 1
- 104 Thorndike St Unit 2
- 138 Thorndike St
- 110 Spring St
- 64-66 Sixth St Unit 1
- 241 Hurley St Unit 1
- 32 5th St Unit 1
- 93 Third St
- 131 Charles St
- 11 8th St Unit 1
- 11 8th St Unit 2
- 170 Gore St Unit 113
- 170 Gore St Unit 417
- 122 Charles St Unit 124-1
- 213 Third St
- 71 Fulkerson St Unit 210
- 71 Fulkerson St Unit 309
- 262 Monsignor Obrien Hwy Unit 503
- 218 Thorndike St Unit 108
- 57 Hurley St Unit 3
- 96 5th St
- 96 5th St Unit 1
- 117 Thorndike St
- 92 5th St
- 94 5th St Unit 3
- 94 5th St Unit 1
- 90 5th St
- 94 5th St
- 94 5th St
- 90 5th St Unit 2
- 86R 5th St
- 88 5th St
- 88 5th St Unit 2
- 113 Thorndike St
- 121 Thorndike St
- 121 Thorndike St Unit 2L
- 121 Thorndike St Unit 3
- 121 Thorndike St Unit 3R
- 121 Thorndike St Unit 2R
- 111 Thorndike St
Ask me questions while you tour the home.