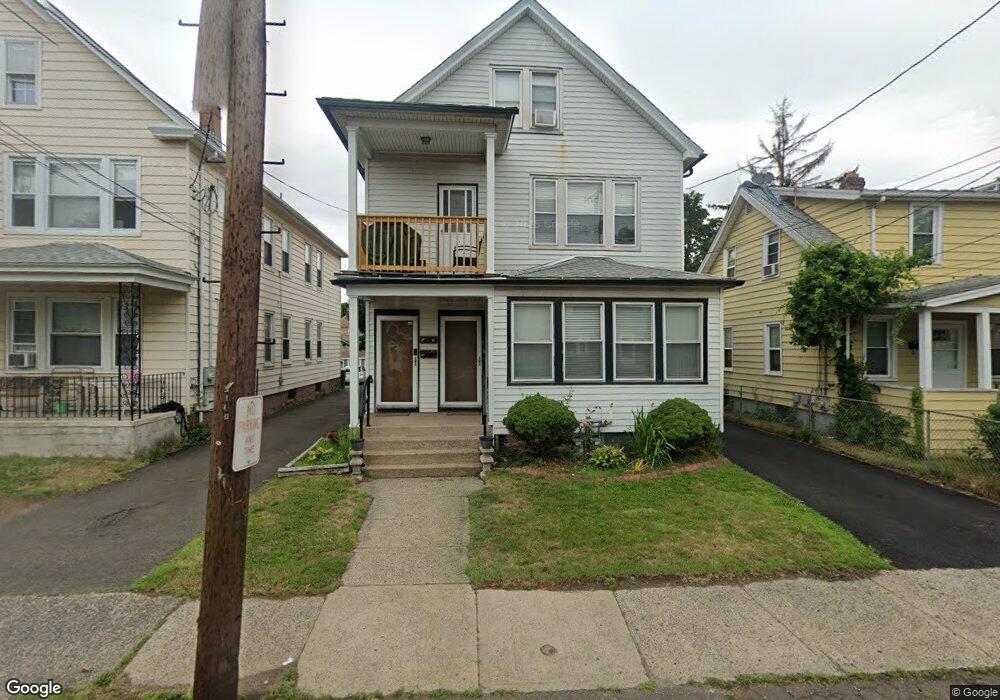
103 Spring St West Haven, CT 06516
Allingtown NeighborhoodEstimated Value: $410,291 - $482,000
4
Beds
3
Baths
2,690
Sq Ft
$170/Sq Ft
Est. Value
About This Home
This home is located at 103 Spring St, West Haven, CT 06516 and is currently estimated at $458,073, approximately $170 per square foot. 103 Spring St is a home located in New Haven County with nearby schools including Carrigan 5/6 Intermediate School, Harry M. Bailey Middle School, and West Haven High School.
Ownership History
Date
Name
Owned For
Owner Type
Purchase Details
Closed on
Jul 29, 2015
Sold by
Ridgway Barbara A and Ridgway Tracy
Bought by
Ridgway Tracy and Ridgway Barbara A
Current Estimated Value
Home Financials for this Owner
Home Financials are based on the most recent Mortgage that was taken out on this home.
Original Mortgage
$118,250
Outstanding Balance
$45,998
Interest Rate
3.97%
Mortgage Type
New Conventional
Estimated Equity
$412,075
Purchase Details
Closed on
Dec 23, 1998
Sold by
Benedetto Rasile Irt and Rasile
Bought by
Klicin Louis N and Klicin Carlene M
Home Financials for this Owner
Home Financials are based on the most recent Mortgage that was taken out on this home.
Original Mortgage
$86,700
Interest Rate
6.75%
Mortgage Type
Purchase Money Mortgage
Create a Home Valuation Report for This Property
The Home Valuation Report is an in-depth analysis detailing your home's value as well as a comparison with similar homes in the area
Home Values in the Area
Average Home Value in this Area
Purchase History
| Date | Buyer | Sale Price | Title Company |
|---|---|---|---|
| Ridgway Tracy | -- | -- | |
| Ridgway Tracy | -- | -- | |
| Klicin Louis N | $85,000 | -- | |
| Klicin Louis N | $85,000 | -- |
Source: Public Records
Mortgage History
| Date | Status | Borrower | Loan Amount |
|---|---|---|---|
| Open | Klicin Louis N | $118,250 | |
| Closed | Klicin Louis N | $118,250 | |
| Previous Owner | Klicin Louis N | $86,700 |
Source: Public Records
Tax History
| Year | Tax Paid | Tax Assessment Tax Assessment Total Assessment is a certain percentage of the fair market value that is determined by local assessors to be the total taxable value of land and additions on the property. | Land | Improvement |
|---|---|---|---|---|
| 2025 | $8,216 | $237,930 | $49,000 | $188,930 |
| 2024 | $7,289 | $150,220 | $33,950 | $116,270 |
| 2023 | $6,987 | $150,220 | $33,950 | $116,270 |
| 2022 | $6,850 | $150,220 | $33,950 | $116,270 |
| 2021 | $4,101 | $150,220 | $33,950 | $116,270 |
| 2020 | $4,101 | $120,820 | $26,530 | $94,290 |
| 2019 | $5,880 | $120,820 | $26,530 | $94,290 |
| 2018 | $5,495 | $120,820 | $26,530 | $94,290 |
| 2017 | $3,613 | $120,820 | $26,530 | $94,290 |
| 2016 | $5,505 | $120,820 | $26,530 | $94,290 |
| 2015 | $5,951 | $147,490 | $31,990 | $115,500 |
| 2014 | $5,914 | $147,490 | $31,990 | $115,500 |
Source: Public Records
Map
Nearby Homes
- 101 Spring St
- 107 Spring St
- 97 Spring St
- 97 Spring St Unit 3
- 111 Spring St Unit 111
- 111 Spring St
- 111 Spring St Unit 113
- 111 Spring St Unit 1
- 121 Spring St
- 95 Spring St
- 115 Spring St
- 117 Spring St
- 50 Lamson St
- 60 Lamson St
- 119 Spring St
- 42 Lamson St
- 62 Lamson St
- 104 Spring St
- 110 Spring St
- 112 Front Ave
Your Personal Tour Guide
Ask me questions while you tour the home.