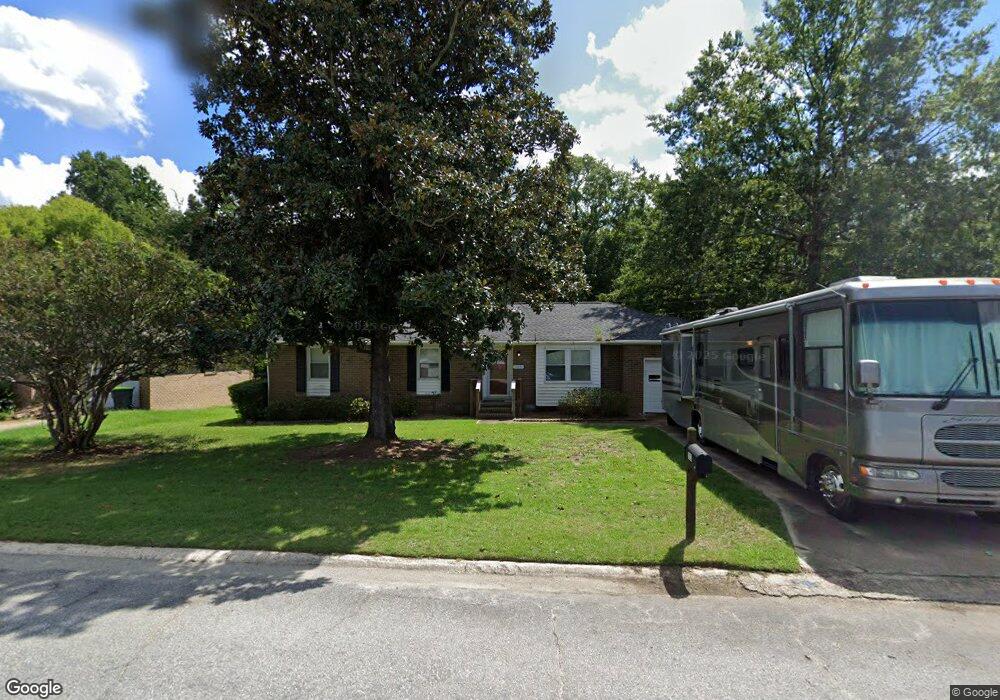
103 Springfield Dr West Columbia, SC 29169
Estimated Value: $196,000 - $213,000
3
Beds
2
Baths
1,330
Sq Ft
$156/Sq Ft
Est. Value
About This Home
This home is located at 103 Springfield Dr, West Columbia, SC 29169 and is currently estimated at $207,735, approximately $156 per square foot. 103 Springfield Dr is a home located in Lexington County with nearby schools including Riverbank Elementary, Northside Middle, and Brookland-Cayce High School.
Ownership History
Date
Name
Owned For
Owner Type
Purchase Details
Closed on
Sep 26, 2018
Sold by
Sfr3 Llc
Bought by
Sfr3 001 Llc
Current Estimated Value
Home Financials for this Owner
Home Financials are based on the most recent Mortgage that was taken out on this home.
Original Mortgage
$7,377,300
Outstanding Balance
$6,433,444
Interest Rate
4.5%
Mortgage Type
Commercial
Estimated Equity
-$6,225,709
Purchase Details
Closed on
May 23, 2018
Sold by
Fannie Mae
Bought by
Hvl97 Cae 2017 01 Merlin Llc
Purchase Details
Closed on
Sep 20, 2017
Sold by
Cit Bank N A
Bought by
Federal National Mortgage Association
Purchase Details
Closed on
Apr 23, 2009
Sold by
Lee Wilson E
Bought by
Lee Wilson E and Lee Frances C
Home Financials for this Owner
Home Financials are based on the most recent Mortgage that was taken out on this home.
Original Mortgage
$191,250
Interest Rate
3.3%
Mortgage Type
Reverse Mortgage Home Equity Conversion Mortgage
Create a Home Valuation Report for This Property
The Home Valuation Report is an in-depth analysis detailing your home's value as well as a comparison with similar homes in the area
Home Values in the Area
Average Home Value in this Area
Purchase History
| Date | Buyer | Sale Price | Title Company |
|---|---|---|---|
| Sfr3 001 Llc | -- | None Available | |
| Sfr3 Llc | -- | None Available | |
| Hvl97 Cae 2017 01 Merlin Llc | $101,500 | None Available | |
| Federal National Mortgage Association | $110,500 | None Available | |
| Lee Wilson E | -- | -- |
Source: Public Records
Mortgage History
| Date | Status | Borrower | Loan Amount |
|---|---|---|---|
| Open | Sfr3 001 Llc | $7,377,300 | |
| Previous Owner | Lee Wilson E | $191,250 |
Source: Public Records
Tax History Compared to Growth
Tax History
| Year | Tax Paid | Tax Assessment Tax Assessment Total Assessment is a certain percentage of the fair market value that is determined by local assessors to be the total taxable value of land and additions on the property. | Land | Improvement |
|---|---|---|---|---|
| 2024 | $2,317 | $6,707 | $1,800 | $4,907 |
| 2023 | $2,317 | $6,707 | $1,800 | $4,907 |
| 2022 | $2,165 | $6,707 | $1,800 | $4,907 |
| 2020 | $2,081 | $6,707 | $1,800 | $4,907 |
| 2019 | $2,035 | $6,495 | $1,500 | $4,995 |
| 2018 | $2,016 | $6,495 | $1,500 | $4,995 |
| 2017 | $215 | $4,330 | $1,000 | $3,330 |
| 2016 | $231 | $4,329 | $1,000 | $3,329 |
| 2014 | $137 | $4,390 | $690 | $3,700 |
| 2013 | -- | $4,390 | $690 | $3,700 |
Source: Public Records
Map
Nearby Homes
- 105 Agape Village Ct
- 38 Shadowfield Dr
- 509 Chisolm Way
- 229 Laurel Meadows Dr
- 416 Heartwood Dr
- 187 Golden Pond Dr
- 240 Saluda Woods Place
- 2720 Hebron Dr
- 108 Wismar St
- 114 Wismar St
- 118 Wismar St
- 212 Mossborough Dr
- 0 Mossborough Dr
- 184 Lott Ct
- 1802 Pine Lake Dr
- 150 Mossborough Dr
- 108 Shady Oak Dr
- 538 Blue Jay Way
- 1631 Fairlane Dr
- 225 Quail Ln
- 101 Springfield Dr
- 105 Springfield Dr
- 107 Springfield Dr
- 99 Springfield Dr
- 119 Longview Dr
- 114 Longview Dr
- 109 Springfield Dr
- 101 Northview Rd
- 100 Savannah Ln
- 117 Longview Dr
- 4141 Mineral Springs Rd
- 106 Springfield Dr
- 102 Savannah Ln
- 112 Longview Rd
- 0 Springdale Rd
- 111 Springfield Dr
- 112 Longview Dr
- 115 Longview Dr
- 108 Springfield Dr
- 104 Savannah Ln