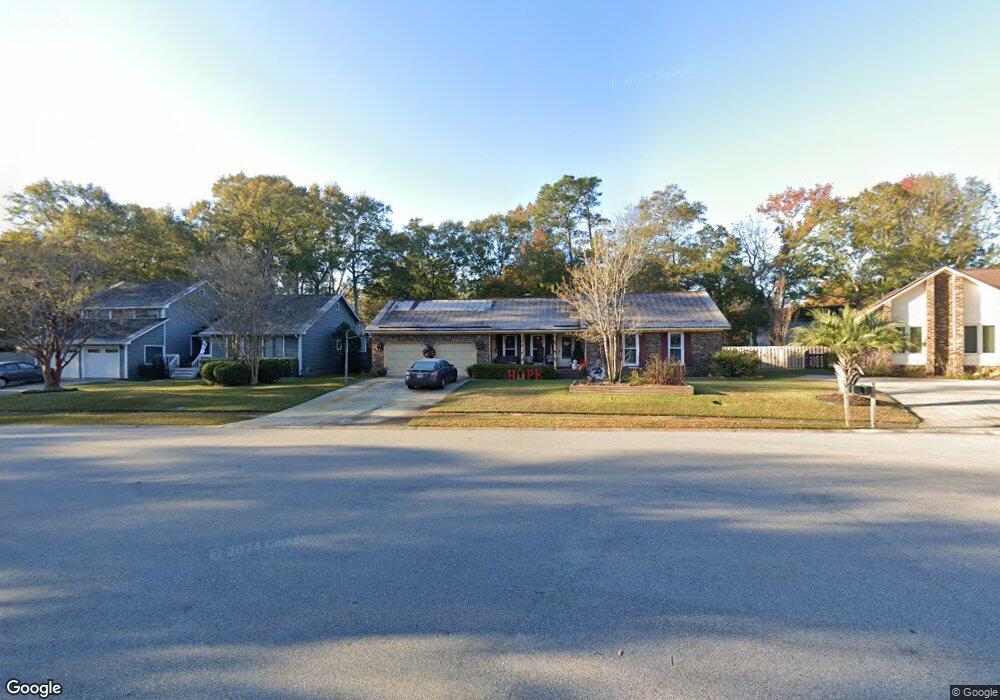
103 Springfield Place Goose Creek, SC 29445
Estimated Value: $316,000 - $337,449
3
Beds
2
Baths
1,640
Sq Ft
$198/Sq Ft
Est. Value
About This Home
This home is located at 103 Springfield Place, Goose Creek, SC 29445 and is currently estimated at $325,112, approximately $198 per square foot. 103 Springfield Place is a home located in Berkeley County with nearby schools including Westview Primary School, Westview Elementary School, and Westview Middle School.
Ownership History
Date
Name
Owned For
Owner Type
Purchase Details
Closed on
Sep 25, 2024
Sold by
Black James and Black Margo
Bought by
Black Family Revocable Living Trust and Black
Current Estimated Value
Purchase Details
Closed on
Nov 28, 2005
Sold by
Whaley Llewellyn and Whaley Tamyra C
Bought by
Black James and Black Margo
Home Financials for this Owner
Home Financials are based on the most recent Mortgage that was taken out on this home.
Original Mortgage
$144,900
Interest Rate
5.57%
Mortgage Type
Future Advance Clause Open End Mortgage
Purchase Details
Closed on
May 27, 2005
Sold by
Roman Dino P and Roman Carolyn D
Bought by
Whaley Llewellyn R and Whaley Tamyra C
Home Financials for this Owner
Home Financials are based on the most recent Mortgage that was taken out on this home.
Original Mortgage
$130,400
Interest Rate
7.25%
Mortgage Type
Adjustable Rate Mortgage/ARM
Create a Home Valuation Report for This Property
The Home Valuation Report is an in-depth analysis detailing your home's value as well as a comparison with similar homes in the area
Home Values in the Area
Average Home Value in this Area
Purchase History
| Date | Buyer | Sale Price | Title Company |
|---|---|---|---|
| Black Family Revocable Living Trust | -- | None Listed On Document | |
| Black James | $169,900 | None Available | |
| Whaley Llewellyn R | $163,000 | -- |
Source: Public Records
Mortgage History
| Date | Status | Borrower | Loan Amount |
|---|---|---|---|
| Previous Owner | Black James | $144,900 | |
| Previous Owner | Whaley Llewellyn R | $130,400 |
Source: Public Records
Tax History Compared to Growth
Tax History
| Year | Tax Paid | Tax Assessment Tax Assessment Total Assessment is a certain percentage of the fair market value that is determined by local assessors to be the total taxable value of land and additions on the property. | Land | Improvement |
|---|---|---|---|---|
| 2025 | $1,150 | $205,649 | $42,466 | $163,183 |
| 2024 | $1,150 | $12,339 | $2,548 | $9,791 |
| 2023 | $1,150 | $8,226 | $1,699 | $6,527 |
| 2022 | $1,128 | $7,153 | $1,687 | $5,466 |
| 2021 | $1,215 | $7,160 | $1,687 | $5,466 |
| 2020 | $1,161 | $7,153 | $1,687 | $5,466 |
| 2019 | $1,110 | $7,153 | $1,687 | $5,466 |
| 2018 | $1,013 | $6,220 | $1,400 | $4,820 |
| 2017 | $1,005 | $6,220 | $1,400 | $4,820 |
| 2016 | $1,012 | $6,220 | $1,400 | $4,820 |
| 2015 | $954 | $6,220 | $1,400 | $4,820 |
| 2014 | $899 | $6,220 | $1,400 | $4,820 |
| 2013 | -- | $6,220 | $1,400 | $4,820 |
Source: Public Records
Map
Nearby Homes
- 18 Rudwick Cir Unit 18
- 206 Alston Cir
- 112 Chownings Ln
- 201 Commons Way
- 103 Old Post Cir
- 108 Williamsburg Ct
- 18 Indigo Ln
- 113 Wessex Dr
- 135 Commons Way
- 216 Holly Ave
- 100 Lexington Place
- 58 Indigo Ln
- 203 Blenheim Ct
- 100 Conset Bay Ct
- 102 Winding Rock Rd
- 136 Harrow Place
- 105 Shelton Ln
- 407 Farm Rd
- 111 Prentice Cir
- 301 Farm Rd
- 101 Springfield Place
- 105 Springfield Place
- 141 Fox Chase Dr
- 139 Fox Chase Dr
- 137 Fox Chase Dr
- 143 Fox Chase Dr
- 104 Springfield Place
- 135 Fox Chase Dr
- 147 Fox Chase Dr
- 145 Fox Chase Dr
- 107 Springfield Place
- 133 Fox Chase Dr
- 106 Springfield Place
- 100 Springfield Place
- 131 Fox Chase Dr
- 128 Fox Chase Dr
- 130 Fox Chase Dr
- 132 Fox Chase Dr
- 149 Fox Chase Dr
- 126 Fox Chase Dr