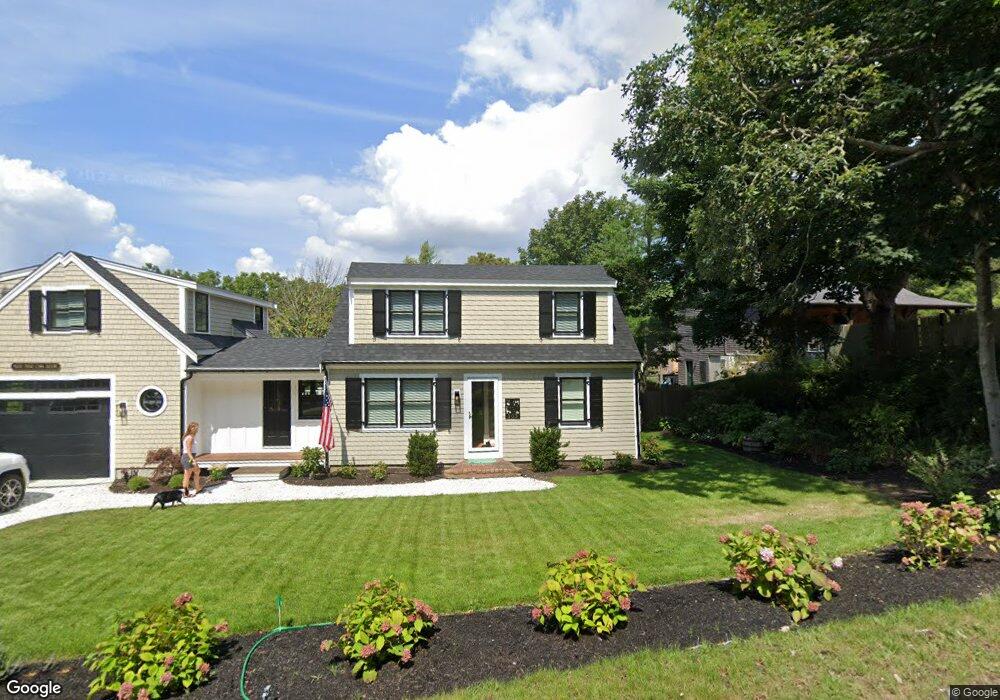
103 Stony Hill Rd Chatham, MA 02633
North Chatham NeighborhoodEstimated Value: $902,000 - $1,139,914
2
Beds
1
Bath
900
Sq Ft
$1,131/Sq Ft
Est. Value
About This Home
This home is located at 103 Stony Hill Rd, Chatham, MA 02633 and is currently estimated at $1,017,979, approximately $1,131 per square foot. 103 Stony Hill Rd is a home located in Barnstable County with nearby schools including Chatham Elementary School, Harwich Elementary School, and Monomoy Regional Middle School.
Ownership History
Date
Name
Owned For
Owner Type
Purchase Details
Closed on
Oct 9, 2024
Sold by
Dyer Michael T and Dyer Janet
Bought by
Linus J Cat Rt and Dyer
Current Estimated Value
Purchase Details
Closed on
Aug 2, 2010
Sold by
Goble 3Rd Sherman M and Goble Carol Ann
Bought by
Dyer Michael T and Dyer Janet
Purchase Details
Closed on
Aug 13, 1996
Sold by
Buff Robert W and Buff Bridget B
Bought by
Goble Sherman M and Goble Carol Ann
Purchase Details
Closed on
Oct 9, 1992
Sold by
Federal Deposit Insurance Corporation
Bought by
Robert W Buff W and Robert Buff
Purchase Details
Closed on
Sep 5, 1991
Sold by
First Plymouth Nominee
Bought by
Mortgage Corp Of N E
Purchase Details
Closed on
Dec 22, 1988
Sold by
Stoney Hill Rt
Bought by
First Plymouth Nominee
Create a Home Valuation Report for This Property
The Home Valuation Report is an in-depth analysis detailing your home's value as well as a comparison with similar homes in the area
Home Values in the Area
Average Home Value in this Area
Purchase History
| Date | Buyer | Sale Price | Title Company |
|---|---|---|---|
| Linus J Cat Rt | -- | None Available | |
| Linus J Cat Rt | -- | None Available | |
| Dyer Michael T | $255,000 | -- | |
| Goble Sherman M | $99,900 | -- | |
| Robert W Buff W | $63,000 | -- | |
| Mortgage Corp Of N E | $85,000 | -- | |
| Dyer Michael T | $255,000 | -- | |
| Goble Sherman M | $99,900 | -- | |
| Robert W Buff W | $63,000 | -- | |
| Mortgage Corp Of N E | $85,000 | -- | |
| First Plymouth Nominee | $98,000 | -- |
Source: Public Records
Mortgage History
| Date | Status | Borrower | Loan Amount |
|---|---|---|---|
| Previous Owner | First Plymouth Nominee | $195,000 | |
| Previous Owner | First Plymouth Nominee | $17,000 |
Source: Public Records
Tax History Compared to Growth
Tax History
| Year | Tax Paid | Tax Assessment Tax Assessment Total Assessment is a certain percentage of the fair market value that is determined by local assessors to be the total taxable value of land and additions on the property. | Land | Improvement |
|---|---|---|---|---|
| 2025 | $3,125 | $900,600 | $236,500 | $664,100 |
| 2024 | $2,616 | $732,800 | $223,100 | $509,700 |
| 2023 | $1,492 | $384,500 | $158,000 | $226,500 |
| 2022 | $1,435 | $310,500 | $158,000 | $152,500 |
| 2021 | $1,406 | $282,300 | $143,600 | $138,700 |
| 2020 | $1,319 | $273,700 | $135,100 | $138,600 |
| 2019 | $1,323 | $272,800 | $134,200 | $138,600 |
| 2018 | $1,211 | $248,600 | $126,300 | $122,300 |
| 2017 | $1,214 | $241,400 | $122,600 | $118,800 |
| 2016 | $1,172 | $233,500 | $135,200 | $98,300 |
| 2015 | $1,148 | $230,000 | $131,400 | $98,600 |
| 2014 | $1,085 | $213,600 | $115,000 | $98,600 |
Source: Public Records
Map
Nearby Homes
- 111 Enterprise Dr
- 231 Crowell Rd
- 27 Martha Kendrick Dr
- 39 Meadow Brook Rd
- 109 Misty Meadow Ln Unit 2
- 109 Misty Meadow Ln Unit 4
- 230 Barcliff Ave
- 44 Emery Ln
- 93 Orleans Rd
- 24 Hillcrest Rd
- 92 Barcliff Ave
- 912 Main St Unit 304
- 552 Orleans Rd
- 552 Orleans Rd
- 98 Horizon Dr
- 55 Winterset Dr
- 29 Wilfred Rd
- 597 Orleans Rd
- 207 Horizon Dr
- 111 Stony Hill Rd
- 93 Stony Hill Rd
- 85 Stony Hill Rd
- 121 Stony Hill Rd
- 8 Nonantum Ln
- 6 Elkanah St
- 10 Nonantum Ln
- 20 Elkanah St
- 73 Stony Hill Rd
- 4 Nonantum Ln
- 16 Nonantum Ln
- 79 Stony Hill Rd
- 137 Stony Hill Rd
- 65 Stony Hill Rd
- 7 Elkanah St
- 24 Nonantum Ln
- 111 Bishops Terrace
- 50 Elkanah St
- 19 Elkanah St
- 15 Elkanah St