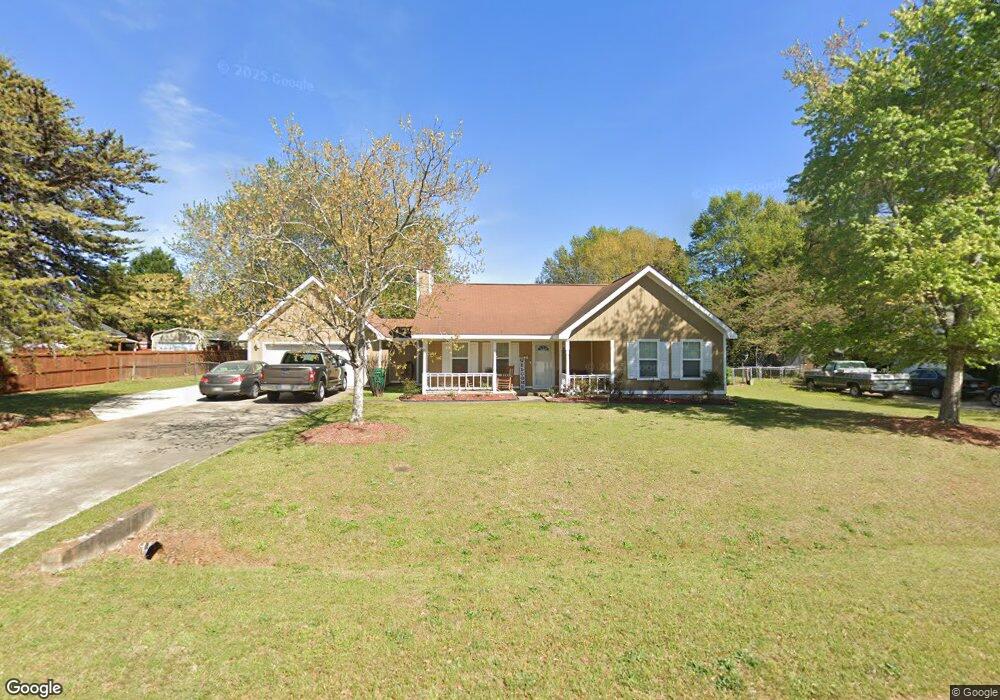
103 Tappan Ct Warner Robins, GA 31088
Estimated Value: $225,082 - $258,000
3
Beds
2
Baths
1,379
Sq Ft
$174/Sq Ft
Est. Value
About This Home
This home is located at 103 Tappan Ct, Warner Robins, GA 31088 and is currently estimated at $239,271, approximately $173 per square foot. 103 Tappan Ct is a home located in Houston County with nearby schools including Lake Joy Primary School, Lake Joy Elementary School, and Mossy Creek Middle School.
Ownership History
Date
Name
Owned For
Owner Type
Purchase Details
Closed on
May 3, 2006
Sold by
Hayslip Hayslip Pamela S Pamela S and Hayslip Doyle Pamela
Bought by
Hayslip Etheridge Ryan Kennerly and Hayslip Doyle Pamela
Current Estimated Value
Purchase Details
Closed on
Jul 15, 1999
Sold by
Kast Buster J
Bought by
Jones Carlton L and Jones Tami A
Purchase Details
Closed on
Mar 31, 1999
Sold by
Kast Mary Nicole
Bought by
Kast Buster J
Purchase Details
Closed on
Apr 30, 1997
Sold by
Mullings John E and Mullings Kelly J
Bought by
Kast Buster J and Mary Nicole
Purchase Details
Closed on
May 1, 1990
Sold by
Garrard Gary
Bought by
Mullings John E and Mullings Kelly J
Purchase Details
Closed on
Aug 21, 1989
Sold by
Pioneer Holdings & Development Inc
Bought by
Garrard Gary
Purchase Details
Closed on
Aug 1, 1989
Sold by
Pioneer Holdings & Development Inc
Bought by
Garrard Gary
Create a Home Valuation Report for This Property
The Home Valuation Report is an in-depth analysis detailing your home's value as well as a comparison with similar homes in the area
Home Values in the Area
Average Home Value in this Area
Purchase History
| Date | Buyer | Sale Price | Title Company |
|---|---|---|---|
| Hayslip Etheridge Ryan Kennerly | -- | None Available | |
| Jones Carlton L | $89,500 | -- | |
| Kast Buster J | -- | -- | |
| Kast Buster J | $82,500 | -- | |
| Mullings John E | -- | -- | |
| Garrard Gary | -- | -- | |
| Garrard Gary | -- | -- |
Source: Public Records
Tax History Compared to Growth
Tax History
| Year | Tax Paid | Tax Assessment Tax Assessment Total Assessment is a certain percentage of the fair market value that is determined by local assessors to be the total taxable value of land and additions on the property. | Land | Improvement |
|---|---|---|---|---|
| 2024 | $1,403 | $60,640 | $10,800 | $49,840 |
| 2023 | $1,246 | $53,560 | $10,800 | $42,760 |
| 2022 | $1,214 | $52,240 | $10,800 | $41,440 |
| 2021 | $1,138 | $48,840 | $10,800 | $38,040 |
| 2020 | $1,014 | $43,560 | $8,400 | $35,160 |
| 2019 | $1,014 | $43,560 | $8,400 | $35,160 |
| 2018 | $1,014 | $43,560 | $8,400 | $35,160 |
| 2017 | $1,015 | $43,560 | $8,400 | $35,160 |
| 2016 | $941 | $40,440 | $8,400 | $32,040 |
| 2015 | $943 | $40,440 | $8,400 | $32,040 |
| 2014 | -- | $40,440 | $8,400 | $32,040 |
| 2013 | -- | $40,440 | $8,400 | $32,040 |
Source: Public Records
Map
Nearby Homes