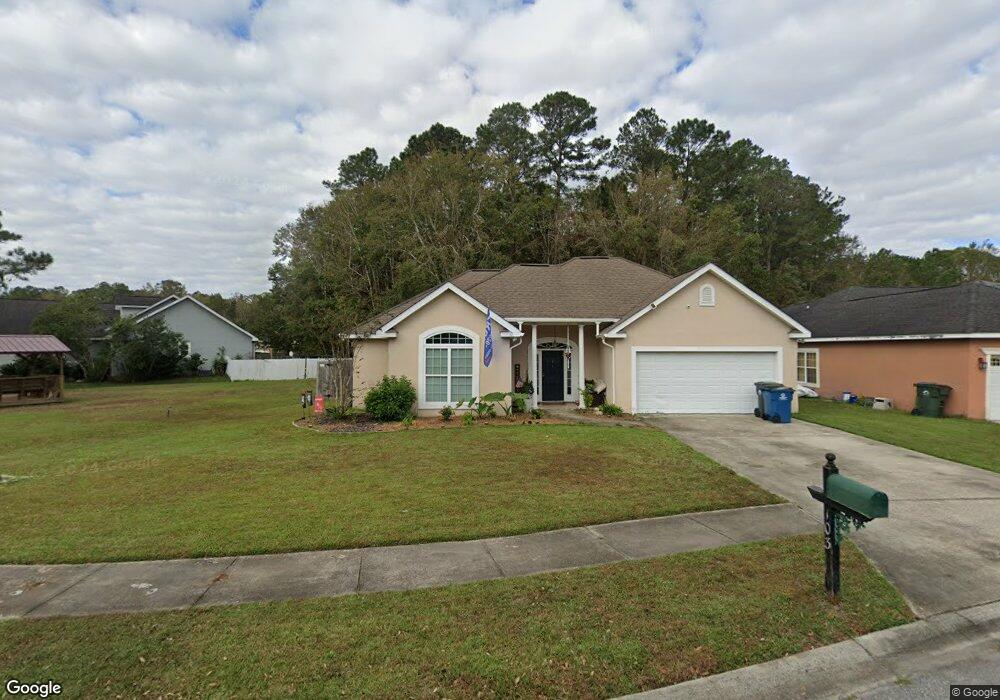
103 Teak Trail Brunswick, GA 31525
Estimated Value: $316,000 - $338,000
3
Beds
2
Baths
1,850
Sq Ft
$176/Sq Ft
Est. Value
About This Home
This home is located at 103 Teak Trail, Brunswick, GA 31525 and is currently estimated at $324,817, approximately $175 per square foot. 103 Teak Trail is a home located in Glynn County with nearby schools including Greer Elementary School, Needwood Middle School, and Brunswick High School.
Ownership History
Date
Name
Owned For
Owner Type
Purchase Details
Closed on
Feb 25, 2008
Sold by
Lasalle Bank National Asso
Bought by
Powers Amanda and Powers Brian
Current Estimated Value
Home Financials for this Owner
Home Financials are based on the most recent Mortgage that was taken out on this home.
Original Mortgage
$183,800
Outstanding Balance
$112,248
Interest Rate
5.46%
Mortgage Type
New Conventional
Estimated Equity
$212,569
Purchase Details
Closed on
Nov 6, 2007
Sold by
Lands Jesse
Bought by
Lasalle Bank National Associat
Purchase Details
Closed on
Aug 28, 2007
Sold by
Lands Heather R
Bought by
Lands Jesse G
Purchase Details
Closed on
Sep 16, 2005
Sold by
Wab Llc
Bought by
Lands Jesse G
Home Financials for this Owner
Home Financials are based on the most recent Mortgage that was taken out on this home.
Original Mortgage
$154,160
Interest Rate
9.3%
Mortgage Type
New Conventional
Create a Home Valuation Report for This Property
The Home Valuation Report is an in-depth analysis detailing your home's value as well as a comparison with similar homes in the area
Home Values in the Area
Average Home Value in this Area
Purchase History
| Date | Buyer | Sale Price | Title Company |
|---|---|---|---|
| Powers Amanda | $193,500 | -- | |
| Lasalle Bank National Associat | $166,688 | -- | |
| Lands Jesse G | -- | -- | |
| Lands Jesse G | $192,700 | -- |
Source: Public Records
Mortgage History
| Date | Status | Borrower | Loan Amount |
|---|---|---|---|
| Open | Powers Amanda | $183,800 | |
| Previous Owner | Lands Jesse G | $154,160 | |
| Previous Owner | Lands Jesse G | $38,540 |
Source: Public Records
Tax History Compared to Growth
Tax History
| Year | Tax Paid | Tax Assessment Tax Assessment Total Assessment is a certain percentage of the fair market value that is determined by local assessors to be the total taxable value of land and additions on the property. | Land | Improvement |
|---|---|---|---|---|
| 2025 | $2,890 | $115,240 | $6,400 | $108,840 |
| 2024 | $2,903 | $115,760 | $6,400 | $109,360 |
| 2023 | $2,970 | $115,760 | $6,400 | $109,360 |
| 2022 | $2,572 | $97,560 | $6,400 | $91,160 |
| 2021 | $2,231 | $81,440 | $6,400 | $75,040 |
| 2020 | $2,137 | $77,040 | $5,600 | $71,440 |
| 2019 | $2,044 | $73,480 | $5,600 | $67,880 |
| 2018 | $2,044 | $73,480 | $5,600 | $67,880 |
| 2017 | $1,812 | $64,600 | $5,600 | $59,000 |
| 2016 | $1,628 | $62,640 | $5,600 | $57,040 |
| 2015 | $1,414 | $53,480 | $5,600 | $47,880 |
| 2014 | $1,414 | $53,480 | $5,600 | $47,880 |
Source: Public Records
Map
Nearby Homes
- 139 Hardwood Forest Dr
- 33 Shadowlake Ct
- 21 Hardwood Forest Cir
- 115 Delaware Dr
- 605 Freedom Trail
- 425 Belmont Cir
- 242 Promise Ln
- 85 Wellington Cir
- 214 Allie Loop
- 200 Allie Loop
- 192 Allie Loop
- 188 Allie Loop
- 193 Allie Loop
- 191 Allie Loop
- 90 Allie Loop
- 20 Kadie Anna Ln
- 29 Kadie Anna Ln
- 40 Arbor Point
- 213 Belmont Cir
- 18 Clover Mill Point
- 105 Teak Trail
- 160 Hardwood Forest Dr
- 107 Teak Trail
- 164 Hardwood Forest Dr
- 155 Hardwood Forest Dr
- 153 Hardwood Forest Dr
- 109 Teak Trail
- 159 Hardwood Forest Dr
- 149 Hardwood Forest Dr
- 161 Hardwood Forest Dr
- 166 Hardwood Forest Dr
- 146 Hardwood Forest Dr
- 163 Hardwood Forest Dr
- 111 Teak Trail
- 110 Teak Trail
- 12 Drake Elm Trail
- 168 Hardwood Forest Dr
- 165 Hardwood Forest Dr
- 144 Hardwood Forest Dr
- 113 Teak Trail