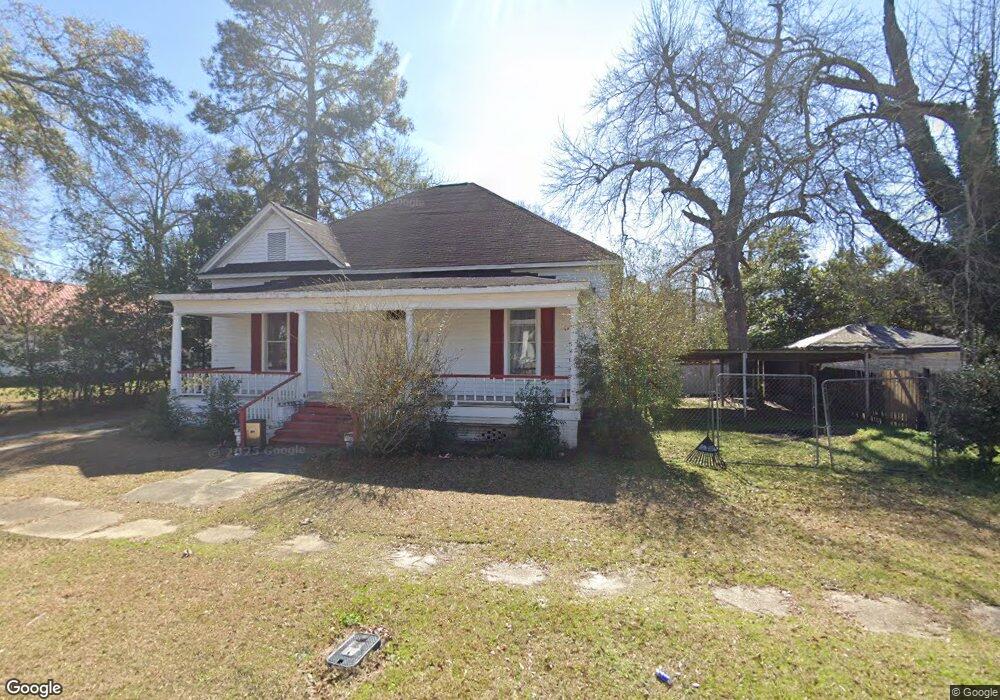
103 Vinson Ave Montezuma, GA 31063
Estimated Value: $97,000 - $154,000
--
Bed
1
Bath
1,660
Sq Ft
$73/Sq Ft
Est. Value
About This Home
This home is located at 103 Vinson Ave, Montezuma, GA 31063 and is currently estimated at $120,884, approximately $72 per square foot. 103 Vinson Ave is a home located in Macon County with nearby schools including Macon County Elementary School, Macon County Middle School, and Macon County High School.
Ownership History
Date
Name
Owned For
Owner Type
Purchase Details
Closed on
Mar 18, 2021
Sold by
Bonde Llc
Bought by
Barrington Dairy Llc
Current Estimated Value
Purchase Details
Closed on
Dec 18, 2020
Sold by
Molleno Jimmy N
Bought by
Bonde Llc
Purchase Details
Closed on
Jul 24, 2006
Sold by
Kaufmann Roland
Bought by
Molleno Jimmy N
Home Financials for this Owner
Home Financials are based on the most recent Mortgage that was taken out on this home.
Original Mortgage
$43,600
Interest Rate
6.68%
Mortgage Type
New Conventional
Purchase Details
Closed on
Aug 29, 2003
Sold by
Kaufman Heidi
Bought by
Kaufman Roland
Purchase Details
Closed on
Mar 29, 1996
Sold by
Kauffman Roland
Bought by
Kauffman Roland and Kauffman H
Purchase Details
Closed on
Sep 23, 1993
Sold by
Bailey Diamme Robin
Bought by
Kauffman Roland
Purchase Details
Closed on
Sep 7, 1993
Bought by
Bailey Diamme Robin
Create a Home Valuation Report for This Property
The Home Valuation Report is an in-depth analysis detailing your home's value as well as a comparison with similar homes in the area
Home Values in the Area
Average Home Value in this Area
Purchase History
| Date | Buyer | Sale Price | Title Company |
|---|---|---|---|
| Barrington Dairy Llc | $67,000 | -- | |
| Bonde Llc | $39,000 | -- | |
| Molleno Jimmy N | $43,600 | -- | |
| Kaufman Roland | -- | -- | |
| Kauffman Roland | -- | -- | |
| Kauffman Roland | $23,000 | -- | |
| Bailey Diamme Robin | -- | -- |
Source: Public Records
Mortgage History
| Date | Status | Borrower | Loan Amount |
|---|---|---|---|
| Previous Owner | Molleno Jimmy N | $43,600 |
Source: Public Records
Tax History Compared to Growth
Tax History
| Year | Tax Paid | Tax Assessment Tax Assessment Total Assessment is a certain percentage of the fair market value that is determined by local assessors to be the total taxable value of land and additions on the property. | Land | Improvement |
|---|---|---|---|---|
| 2024 | $1,288 | $30,590 | $1,159 | $29,431 |
| 2023 | $1,288 | $30,590 | $1,159 | $29,431 |
| 2022 | $656 | $22,550 | $1,159 | $21,391 |
| 2021 | $688 | $16,170 | $1,159 | $15,011 |
| 2020 | $432 | $16,170 | $1,159 | $15,011 |
| 2019 | $688 | $16,170 | $1,159 | $15,011 |
| 2018 | $433 | $16,170 | $1,159 | $15,011 |
| 2017 | $433 | $16,170 | $1,159 | $15,011 |
| 2016 | $434 | $16,170 | $1,159 | $15,011 |
| 2015 | -- | $18,029 | $1,159 | $16,871 |
| 2014 | -- | $18,030 | $1,159 | $16,871 |
| 2013 | -- | $18,029 | $1,158 | $16,870 |
Source: Public Records
Map
Nearby Homes
- 103 E Artesian Ave
- 326 N Dooly St
- 416 Engram St
- 100 Minor Ave
- 202 Minor Ave
- 505 Engram St
- 601 Engram St
- 504 Patricia Dr
- 510 Patricia Dr
- 102 June Dr
- 514 Patricia Dr
- 311 Overlook Dr
- 511 Forsyth St
- 203 Combs Dr
- 9198 Georgia 224
- 399 Travelers Rest Rd
- 803 Vienna Rd
- 0 Georgia 49
- 432 Clifton Bradley Dr
- Whitewater Rd