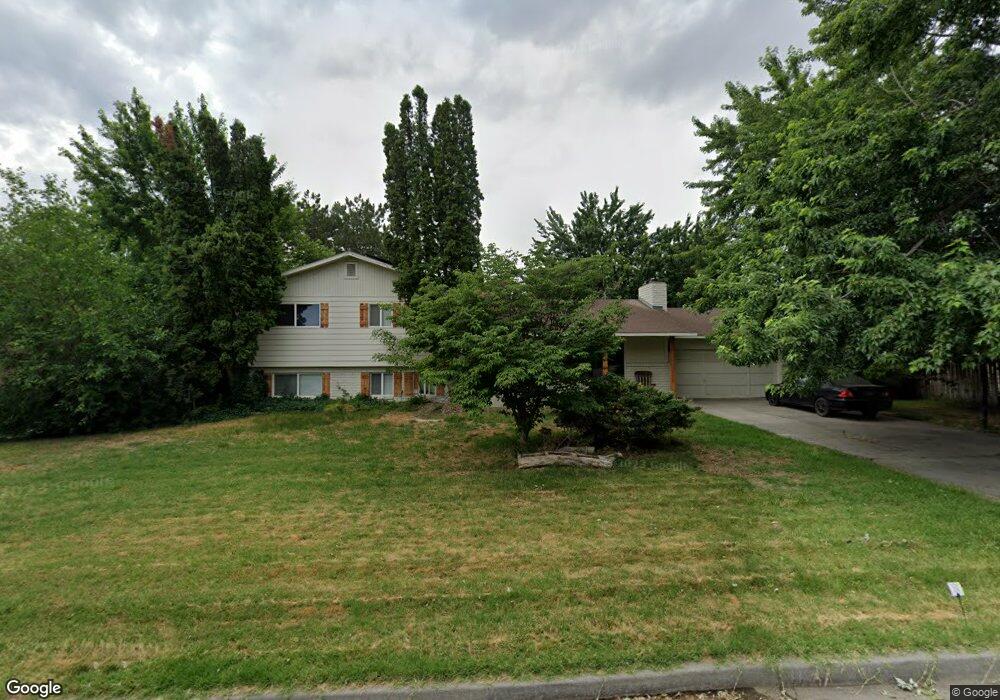
103 W 36th Place Unit Peaceful quiet neigh Kennewick, WA 99337
Estimated Value: $445,252 - $584,000
3
Beds
2
Baths
2,325
Sq Ft
$216/Sq Ft
Est. Value
About This Home
This home is located at 103 W 36th Place Unit Peaceful quiet neigh, Kennewick, WA 99337 and is currently estimated at $501,813, approximately $215 per square foot. 103 W 36th Place Unit Peaceful quiet neigh is a home located in Benton County with nearby schools including Cascade Elementary School, Horse Heaven Hills Middle School, and Kennewick High School.
Ownership History
Date
Name
Owned For
Owner Type
Purchase Details
Closed on
Feb 4, 2022
Sold by
Wesley Root Brandon and Root Luz
Bought by
Root Brandon Wesley
Current Estimated Value
Home Financials for this Owner
Home Financials are based on the most recent Mortgage that was taken out on this home.
Original Mortgage
$335,000
Outstanding Balance
$311,073
Interest Rate
3.55%
Mortgage Type
New Conventional
Estimated Equity
$190,740
Purchase Details
Closed on
Mar 14, 2019
Sold by
Tri Construction Llc
Bought by
Root Brandon Wesley
Home Financials for this Owner
Home Financials are based on the most recent Mortgage that was taken out on this home.
Original Mortgage
$299,415
Interest Rate
4.4%
Mortgage Type
FHA
Purchase Details
Closed on
Mar 26, 2018
Sold by
Bank Of America Na
Bought by
Tri Construction Llc
Purchase Details
Closed on
Oct 16, 2017
Sold by
Bullock Travis L and Bullock Carolyn R
Bought by
Bank Of America Na
Create a Home Valuation Report for This Property
The Home Valuation Report is an in-depth analysis detailing your home's value as well as a comparison with similar homes in the area
Home Values in the Area
Average Home Value in this Area
Purchase History
| Date | Buyer | Sale Price | Title Company |
|---|---|---|---|
| Root Brandon Wesley | $313 | None Listed On Document | |
| Root Brandon Wesley | $354,837 | Ticor Title Company | |
| Tri Construction Llc | $205,800 | None Available | |
| Bank Of America Na | $205,800 | None Available |
Source: Public Records
Mortgage History
| Date | Status | Borrower | Loan Amount |
|---|---|---|---|
| Open | Root Brandon Wesley | $335,000 | |
| Previous Owner | Root Brandon Wesley | $299,415 |
Source: Public Records
Tax History Compared to Growth
Tax History
| Year | Tax Paid | Tax Assessment Tax Assessment Total Assessment is a certain percentage of the fair market value that is determined by local assessors to be the total taxable value of land and additions on the property. | Land | Improvement |
|---|---|---|---|---|
| 2024 | $2,955 | $414,940 | $70,000 | $344,940 |
| 2023 | $2,955 | $368,950 | $70,000 | $298,950 |
| 2022 | $3,256 | $299,960 | $70,000 | $229,960 |
| 2021 | $2,964 | $333,320 | $50,000 | $283,320 |
| 2020 | $2,782 | $293,970 | $50,000 | $243,970 |
| 2019 | $2,515 | $263,780 | $50,000 | $213,780 |
| 2018 | $2,834 | $243,740 | $50,000 | $193,740 |
| 2017 | $2,603 | $223,690 | $50,000 | $173,690 |
| 2016 | $3,084 | $223,710 | $45,000 | $178,710 |
| 2015 | $2,968 | $223,710 | $45,000 | $178,710 |
| 2014 | -- | $213,070 | $30,000 | $183,070 |
| 2013 | -- | $213,070 | $30,000 | $183,070 |
Source: Public Records
Map
Nearby Homes
- 4108 S Auburn St
- 106 E 36th Ave
- 4209 S Cascade St
- NKA S Elm Place
- TBD Parcel 118802020001004 & 118802020003004
- 108 W 45th Ave
- 3628 S Date St
- 4505 S Dayton Ct
- 3403 S Hartford St
- 207 W 48th Ave
- 2920 S Everett St
- 2816 S Cedar St
- 4004 S Jean St
- 2803 S Alder St
- 2624 S Beech St
- 2912 S Beech St
- 2732 S Beech St
- 2744 S Beech St
- 2805 S Beech St
- 2829 S Beech St
- 103 W 36th Place Unit AMAZING KITCHEN
- 103 W 36th Place
- 105 W 36th Place
- 101 W 36th Place
- 3819 S Auburn St
- 104 W 36th Place
- 102 W 36th Place
- 107 W 36th Place
- 3906 S Auburn St
- 3607 S Benton St
- 3908 S Auburn St
- 3607 S Auburn St
- 3606 S Auburn St
- 3612 S Benton St
- 3610 S Benton St
- 3614 S Benton St
- 3821 S Auburn St Unit Huge Shop/Great View
- 3821 S Auburn St Unit 2500+ SF SHOP - ALMO
- 3821 S Auburn St
- 3605 S Benton St