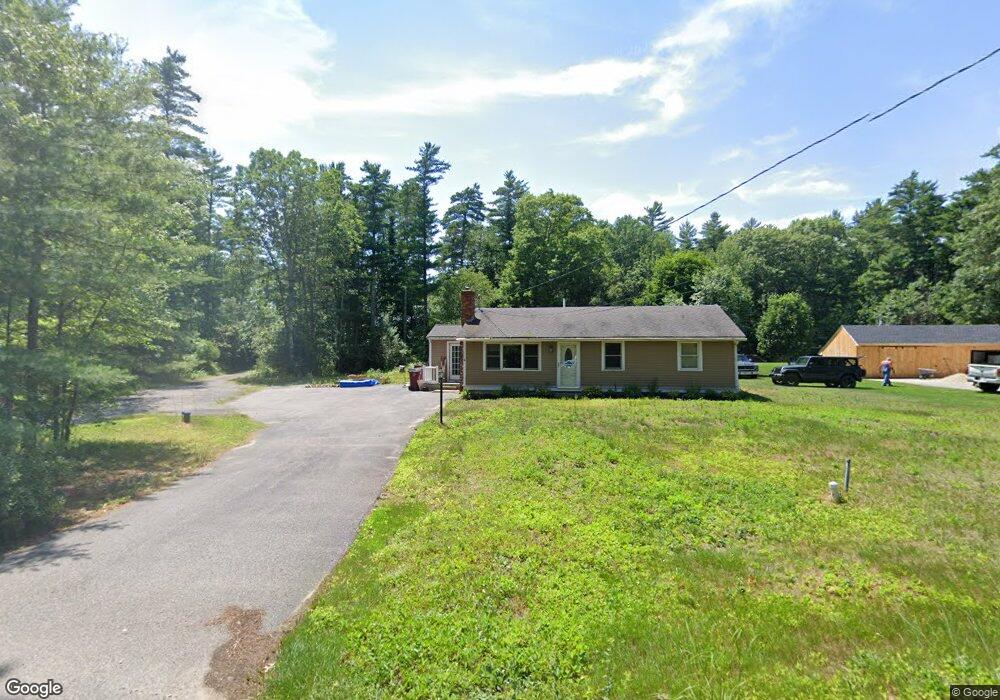
103 Wall St Middleboro, MA 02346
Estimated Value: $447,227 - $533,000
3
Beds
1
Bath
988
Sq Ft
$503/Sq Ft
Est. Value
About This Home
This home is located at 103 Wall St, Middleboro, MA 02346 and is currently estimated at $496,557, approximately $502 per square foot. 103 Wall St is a home located in Plymouth County with nearby schools including Mary K. Goode Elementary School and Samuel Fuller School.
Ownership History
Date
Name
Owned For
Owner Type
Purchase Details
Closed on
Mar 10, 2017
Sold by
Kujanpaa Charlene G
Bought by
Kujanpaa Stephen P and Kujanpaa Charlene G
Current Estimated Value
Purchase Details
Closed on
Nov 21, 2011
Sold by
Kujanpaa Stephen P
Bought by
Kujanpaa Charlene P and Kujanpaa Diane
Purchase Details
Closed on
Nov 30, 2004
Sold by
Wiedl Mary Ann
Bought by
Kujanpaa Stephen P
Create a Home Valuation Report for This Property
The Home Valuation Report is an in-depth analysis detailing your home's value as well as a comparison with similar homes in the area
Home Values in the Area
Average Home Value in this Area
Purchase History
| Date | Buyer | Sale Price | Title Company |
|---|---|---|---|
| Kujanpaa Stephen P | -- | -- | |
| Kujanpaa Charlene P | -- | -- | |
| Kujanpaa Stephen P | $190,000 | -- |
Source: Public Records
Mortgage History
| Date | Status | Borrower | Loan Amount |
|---|---|---|---|
| Previous Owner | Kujanpaa Stephen P | $27,500 |
Source: Public Records
Tax History Compared to Growth
Tax History
| Year | Tax Paid | Tax Assessment Tax Assessment Total Assessment is a certain percentage of the fair market value that is determined by local assessors to be the total taxable value of land and additions on the property. | Land | Improvement |
|---|---|---|---|---|
| 2025 | $4,864 | $362,700 | $164,200 | $198,500 |
| 2024 | $4,758 | $351,400 | $156,400 | $195,000 |
| 2023 | $4,491 | $315,400 | $156,400 | $159,000 |
| 2022 | $4,251 | $276,400 | $136,000 | $140,400 |
| 2021 | $4,136 | $254,200 | $119,200 | $135,000 |
| 2020 | $3,786 | $238,400 | $119,200 | $119,200 |
| 2019 | $3,579 | $231,200 | $119,200 | $112,000 |
| 2018 | $3,326 | $213,200 | $113,200 | $100,000 |
| 2017 | $3,261 | $206,800 | $108,900 | $97,900 |
| 2016 | $3,209 | $201,600 | $99,900 | $101,700 |
| 2015 | $3,001 | $190,200 | $99,900 | $90,300 |
Source: Public Records
Map
Nearby Homes