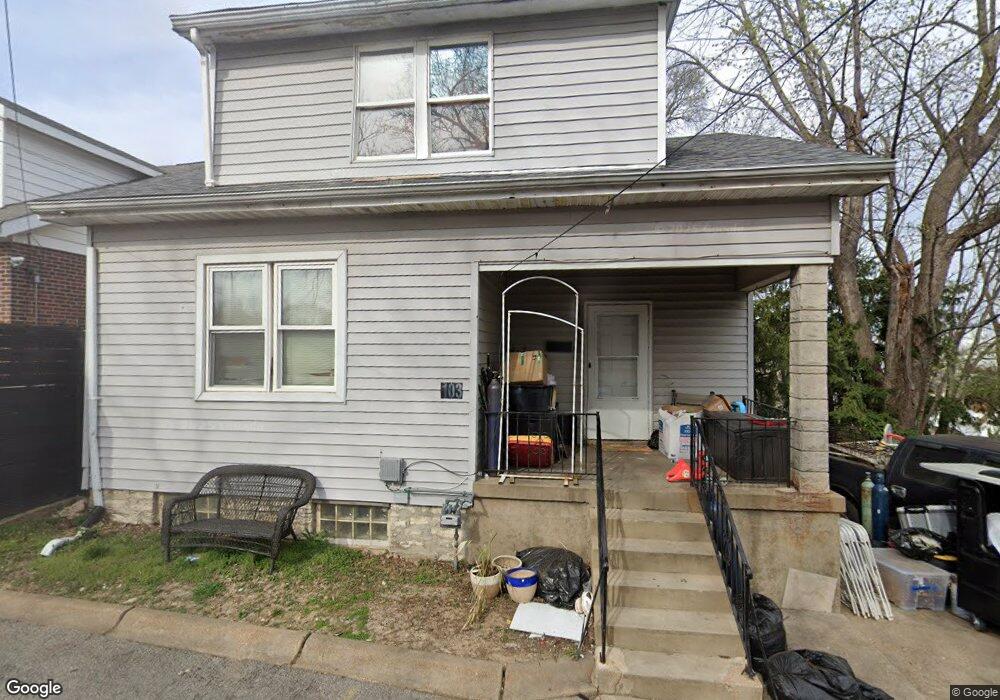
103 Waller Ave Saint Louis, MO 63125
Lemay NeighborhoodEstimated Value: $157,000 - $190,000
--
Bed
2
Baths
806
Sq Ft
$214/Sq Ft
Est. Value
About This Home
This home is located at 103 Waller Ave, Saint Louis, MO 63125 and is currently estimated at $172,792, approximately $214 per square foot. 103 Waller Ave is a home located in St. Louis County with nearby schools including Hancock Place Elementary School, Hancock Place Middle School, and Hancock Place High School.
Ownership History
Date
Name
Owned For
Owner Type
Purchase Details
Closed on
Sep 24, 2010
Sold by
Federal Home Loan Mortgage Corporation
Bought by
Plt08 Llc
Current Estimated Value
Purchase Details
Closed on
Jun 17, 2010
Sold by
Dickhaus Kurt
Bought by
Federal Home Loan Mortgage Corp
Purchase Details
Closed on
Jul 11, 2001
Sold by
Aulbach Gerald and Aulbach Christy
Bought by
Dickhaus Kurt
Home Financials for this Owner
Home Financials are based on the most recent Mortgage that was taken out on this home.
Original Mortgage
$44,000
Interest Rate
7.2%
Purchase Details
Closed on
Aug 16, 1999
Sold by
Aulbach Laverne
Bought by
Aulbach Gerald and Aulbach Christy
Home Financials for this Owner
Home Financials are based on the most recent Mortgage that was taken out on this home.
Original Mortgage
$30,000
Interest Rate
7.68%
Create a Home Valuation Report for This Property
The Home Valuation Report is an in-depth analysis detailing your home's value as well as a comparison with similar homes in the area
Home Values in the Area
Average Home Value in this Area
Purchase History
| Date | Buyer | Sale Price | Title Company |
|---|---|---|---|
| Plt08 Llc | $4,700 | Ctc | |
| Federal Home Loan Mortgage Corp | $40,000 | None Available | |
| Dickhaus Kurt | $55,500 | Capital Title | |
| Aulbach Gerald | $25,000 | -- |
Source: Public Records
Mortgage History
| Date | Status | Borrower | Loan Amount |
|---|---|---|---|
| Previous Owner | Dickhaus Kurt | $44,000 | |
| Previous Owner | Aulbach Gerald | $30,000 |
Source: Public Records
Tax History Compared to Growth
Tax History
| Year | Tax Paid | Tax Assessment Tax Assessment Total Assessment is a certain percentage of the fair market value that is determined by local assessors to be the total taxable value of land and additions on the property. | Land | Improvement |
|---|---|---|---|---|
| 2025 | $2,217 | $28,230 | $8,550 | $19,680 |
| 2024 | $2,217 | $28,610 | $4,370 | $24,240 |
| 2023 | $2,105 | $28,610 | $4,370 | $24,240 |
| 2022 | $1,773 | $21,790 | $4,940 | $16,850 |
| 2021 | $1,742 | $21,790 | $4,940 | $16,850 |
| 2020 | $1,380 | $16,420 | $4,940 | $11,480 |
| 2019 | $1,376 | $16,420 | $4,940 | $11,480 |
| 2018 | $1,344 | $13,980 | $4,370 | $9,610 |
| 2017 | $1,321 | $13,980 | $4,370 | $9,610 |
| 2016 | $1,221 | $12,430 | $1,900 | $10,530 |
| 2015 | $1,214 | $12,430 | $1,900 | $10,530 |
| 2014 | -- | $10,910 | $2,660 | $8,250 |
Source: Public Records
Map
Nearby Homes
- 108 Horn Ave
- 809 Military Rd
- 300 Kayser Ave
- 302 Waller Ave
- 335 Horn Ave
- 235 Military Rd
- 241 Dammert Ave
- 252 Wachtel Ave
- 212 Espenschied St
- 363 Hoffmeister Ave
- 610 Kayser Ave
- 8418 -20 S Broadway
- 522 Lagro Ave
- 720 Erskine Ave
- 622 Kayser Ave
- 112 Mann St
- 119 E Cartwright Ave
- 711 Erskine Ave
- 715 Erskine Ave
- 437 Hoffmeister Ave
- 105 Waller Ave
- 109 Waller Ave
- 9017 S Broadway
- 9015 S Broadway
- 9011 S Broadway
- 104 Kayser Ave
- 106 Kayser Ave
- 108 Kayser Ave
- 110 Kayser Ave
- 9007 S Broadway
- 112 Kayser Ave
- 103 Kayser Ave
- 111 Kayser Ave
- 138 Kayser Ave
- 9129 S Broadway
- 99319935 S Broadway
- 9133 S Broadway
- 140 Kayser Ave
- 101 Horn Ave
- 109 Horn Ave