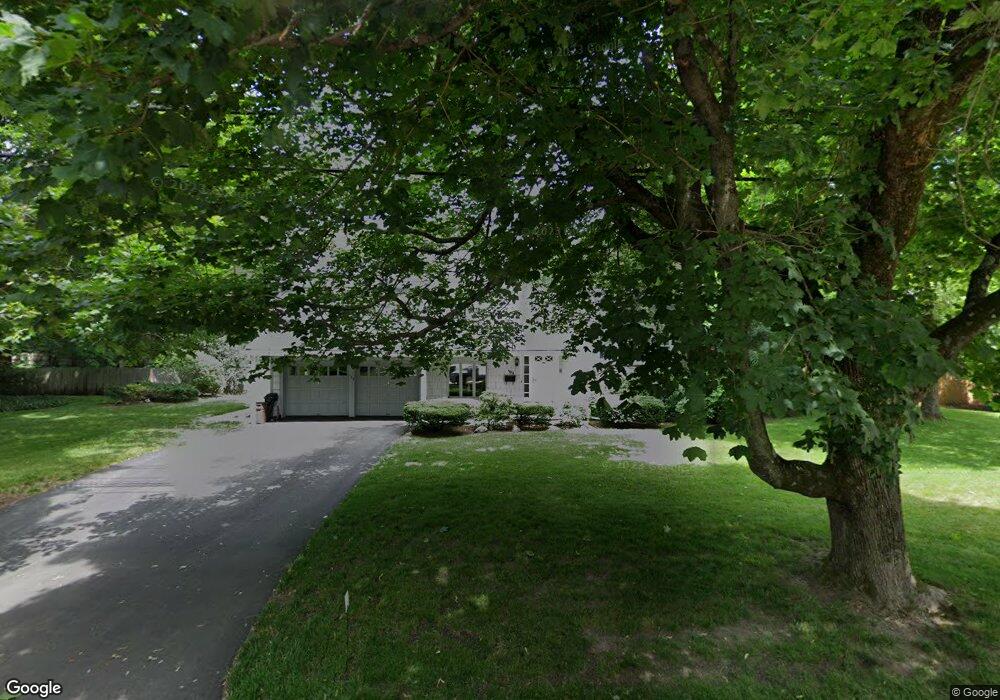
103 Walnut St Natick, MA 01760
Estimated Value: $909,935 - $1,043,000
3
Beds
3
Baths
1,530
Sq Ft
$625/Sq Ft
Est. Value
About This Home
This home is located at 103 Walnut St, Natick, MA 01760 and is currently estimated at $956,234, approximately $624 per square foot. 103 Walnut St is a home located in Middlesex County with nearby schools including Natick High School, Lilja Elementary School, and Wilson Middle School.
Ownership History
Date
Name
Owned For
Owner Type
Purchase Details
Closed on
Feb 22, 2023
Sold by
Peoples Samuel L and Peoples Barbara A
Bought by
103 Walnut Street Rt
Current Estimated Value
Purchase Details
Closed on
Apr 11, 2012
Sold by
Peoples 3Rd Samuel L and Peoples Barbara A
Bought by
Peoples Samuel L and Peoples Barbara A
Purchase Details
Closed on
Feb 1, 1986
Bought by
Peoples Samuel L and Peoples Barbara A
Create a Home Valuation Report for This Property
The Home Valuation Report is an in-depth analysis detailing your home's value as well as a comparison with similar homes in the area
Home Values in the Area
Average Home Value in this Area
Purchase History
| Date | Buyer | Sale Price | Title Company |
|---|---|---|---|
| 103 Walnut Street Rt | -- | None Available | |
| Peoples Samuel L | -- | -- | |
| Peoples Samuel L | $237,000 | -- |
Source: Public Records
Mortgage History
| Date | Status | Borrower | Loan Amount |
|---|---|---|---|
| Previous Owner | Peoples Samuel L | $50,000 | |
| Previous Owner | Peoples Samuel L | $120,000 |
Source: Public Records
Tax History
| Year | Tax Paid | Tax Assessment Tax Assessment Total Assessment is a certain percentage of the fair market value that is determined by local assessors to be the total taxable value of land and additions on the property. | Land | Improvement |
|---|---|---|---|---|
| 2025 | $9,160 | $765,900 | $473,100 | $292,800 |
| 2024 | $8,852 | $722,000 | $446,900 | $275,100 |
| 2023 | $8,691 | $687,600 | $418,500 | $269,100 |
| 2022 | $8,431 | $632,000 | $380,000 | $252,000 |
| 2021 | $8,110 | $595,900 | $359,200 | $236,700 |
| 2020 | $7,898 | $580,300 | $343,600 | $236,700 |
| 2019 | $7,376 | $580,300 | $343,600 | $236,700 |
| 2018 | $7,119 | $545,500 | $312,300 | $233,200 |
| 2017 | $6,872 | $509,400 | $280,400 | $229,000 |
| 2016 | $6,679 | $492,200 | $265,400 | $226,800 |
| 2015 | $6,542 | $473,400 | $265,400 | $208,000 |
Source: Public Records
Map
Nearby Homes
- 41 Charles St
- 142 Bacon St
- 36 Winnemay St
- 20 Florence St Unit B
- 17 Florence St
- 16 Harvard St
- 12 Bay State Rd
- 53 Harvard Street Extension
- 7 Jackson Ct Unit B
- 3 Vale St Unit A
- 34 Marion St
- 9 Bellevue Rd
- 49 Summer St
- 27 2nd St
- 3 Wilson St Unit 3B
- 4B Lincoln St Unit 4B
- 3A Wilson St Unit 3A
- 67 E Central St & 5 Union St
- 293 Bacon St Unit A
- 6A Lincoln St Unit 6A
Your Personal Tour Guide
Ask me questions while you tour the home.