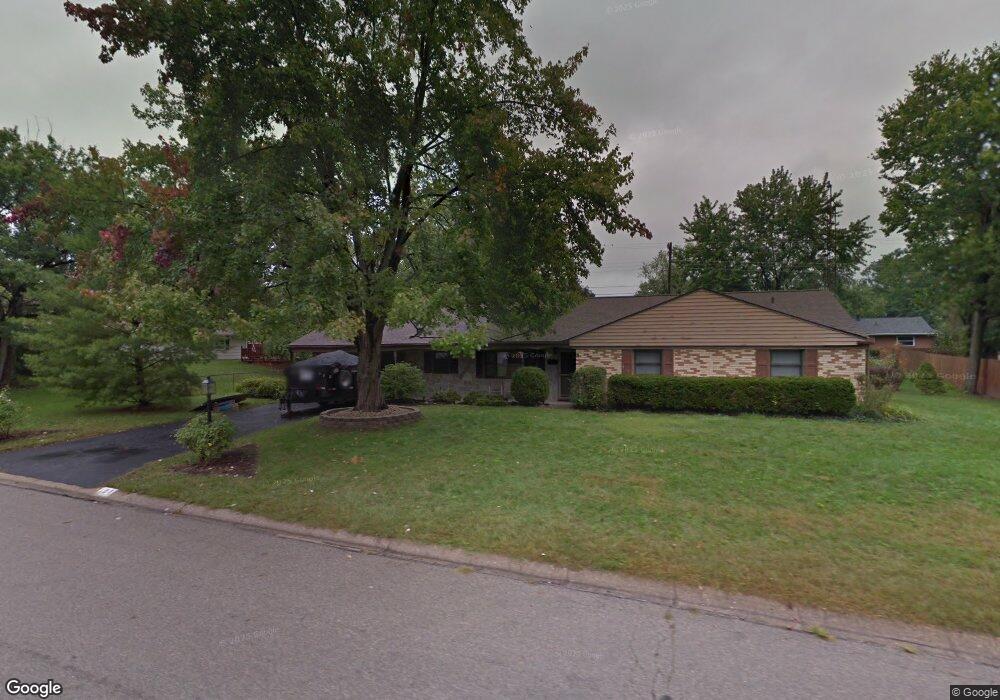
103 Westerly Dr Dayton, OH 45458
Estimated Value: $283,000 - $312,000
4
Beds
2
Baths
1,812
Sq Ft
$165/Sq Ft
Est. Value
About This Home
This home is located at 103 Westerly Dr, Dayton, OH 45458 and is currently estimated at $298,970, approximately $164 per square foot. 103 Westerly Dr is a home located in Montgomery County with nearby schools including Primary Village South, Cline Elementary, and Magsig Middle School.
Ownership History
Date
Name
Owned For
Owner Type
Purchase Details
Closed on
Jun 14, 2006
Sold by
Pender Mark J and Pender Bari A
Bought by
Prudential Relocation Inc
Current Estimated Value
Home Financials for this Owner
Home Financials are based on the most recent Mortgage that was taken out on this home.
Original Mortgage
$31,300
Interest Rate
6.3%
Mortgage Type
Stand Alone Second
Purchase Details
Closed on
Jun 8, 2006
Sold by
Prudential Relocation Inc
Bought by
Fullenkamp Chris
Home Financials for this Owner
Home Financials are based on the most recent Mortgage that was taken out on this home.
Original Mortgage
$31,300
Interest Rate
6.3%
Mortgage Type
Stand Alone Second
Purchase Details
Closed on
Dec 30, 2002
Sold by
Bertke Delbert L and Bertke Jean E
Bought by
Pender Mark J and Pender Bari A
Home Financials for this Owner
Home Financials are based on the most recent Mortgage that was taken out on this home.
Original Mortgage
$130,625
Interest Rate
6.13%
Create a Home Valuation Report for This Property
The Home Valuation Report is an in-depth analysis detailing your home's value as well as a comparison with similar homes in the area
Home Values in the Area
Average Home Value in this Area
Purchase History
| Date | Buyer | Sale Price | Title Company |
|---|---|---|---|
| Prudential Relocation Inc | $156,500 | Midwest Title Company | |
| Fullenkamp Chris | $156,500 | Midwest Title Company | |
| Pender Mark J | $137,500 | -- |
Source: Public Records
Mortgage History
| Date | Status | Borrower | Loan Amount |
|---|---|---|---|
| Closed | Fullenkamp Chris | $31,300 | |
| Open | Prudential Relocation Inc | $125,200 | |
| Closed | Fullenkamp Chris | $125,200 | |
| Previous Owner | Pender Mark J | $130,625 |
Source: Public Records
Tax History Compared to Growth
Tax History
| Year | Tax Paid | Tax Assessment Tax Assessment Total Assessment is a certain percentage of the fair market value that is determined by local assessors to be the total taxable value of land and additions on the property. | Land | Improvement |
|---|---|---|---|---|
| 2024 | $4,643 | $79,900 | $14,400 | $65,500 |
| 2023 | $4,643 | $79,900 | $14,400 | $65,500 |
| 2022 | $4,607 | $62,880 | $11,340 | $51,540 |
| 2021 | $4,619 | $62,880 | $11,340 | $51,540 |
| 2020 | $5,365 | $73,190 | $11,340 | $61,850 |
| 2019 | $4,769 | $58,040 | $11,340 | $46,700 |
| 2018 | $4,228 | $58,040 | $11,340 | $46,700 |
| 2017 | $4,179 | $58,040 | $11,340 | $46,700 |
| 2016 | $4,188 | $54,900 | $11,340 | $43,560 |
| 2015 | $4,145 | $54,900 | $11,340 | $43,560 |
| 2014 | $4,145 | $54,900 | $11,340 | $43,560 |
| 2012 | -- | $46,780 | $11,320 | $35,460 |
Source: Public Records
Map
Nearby Homes
- 51 Winchester (#E) Place
- 61 Lynn Rae Cir
- 170 S Main St Unit C
- 20 Gershwin Dr
- 155 Bristol Dr
- 306 Monarch Rd
- 284 Tauber Dr
- 325 Annette Dr
- 296 Tauber Dr
- 156 Mallard Glen Dr Unit 4
- 140 Mallard Glen Dr Unit 3
- 352 Sentinel Oak Dr
- 92 E Ridgeway Dr
- 40 Cemetery Dr
- 7687 Normandy Ln
- 694 Spring Ridge Place
- 121 Woodfield Place
- 7767 Brams Hill Dr Unit 7767
- 35 Bywood Ct
- 843 Clareridge Ln Unit 843
- 91 Westerly Dr
- 110 Jeanette Ave
- 104 Virginia Ave
- 98 Jeanette Ave
- 118 Jeanette Ave
- 98 Westerly Dr
- 108 Westerly Dr
- 90 Jeanette Ave
- 88 Westerly Dr
- 81 Westerly Dr
- 111 Jeanette Ave
- 95 Peach Grove Ave
- 30 Jeanette Ave
- 117 Jeanette Ave
- 95 Virginia Ave
- 78 Westerly Dr
- 134 Virginia Ave
- 87 Peach Grove Ave
- 49 Westerfield Dr
- 85 Virginia Ave