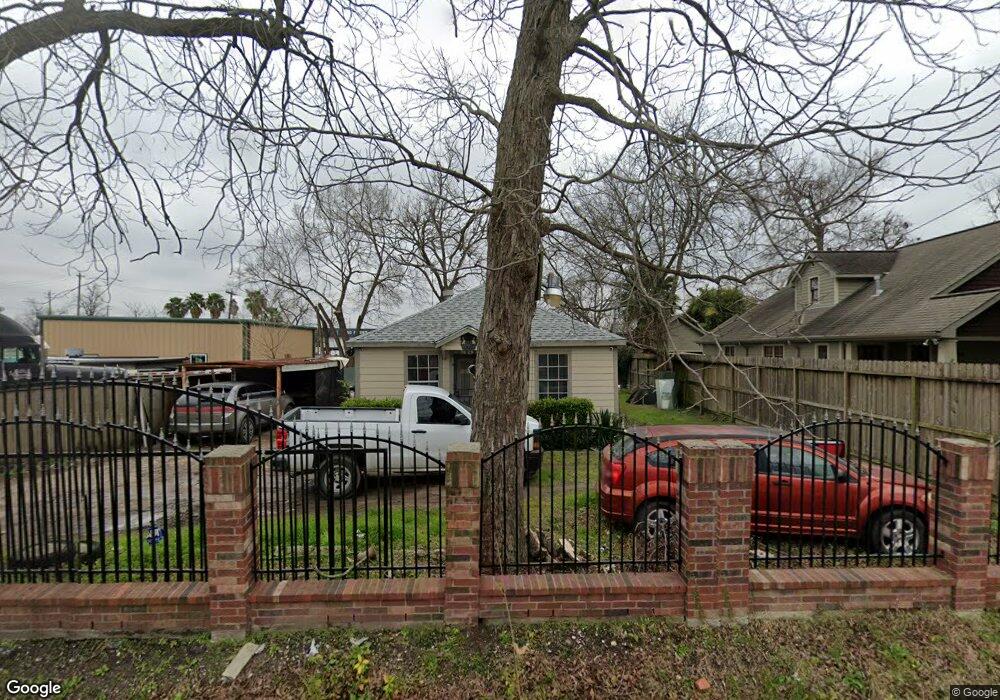
103 Westfield St Houston, TX 77022
Northside-Northline NeighborhoodEstimated Value: $179,061 - $246,000
2
Beds
1
Bath
720
Sq Ft
$297/Sq Ft
Est. Value
About This Home
This home is located at 103 Westfield St, Houston, TX 77022 and is currently estimated at $213,515, approximately $296 per square foot. 103 Westfield St is a home located in Harris County with nearby schools including Herrera Elementary School, Burbank Middle School, and Sam Houston Math, Science & Technology Center.
Ownership History
Date
Name
Owned For
Owner Type
Purchase Details
Closed on
Mar 27, 2001
Sold by
Blunt Pamela Ann Richbourg and Richbourg Betty Ruth
Bought by
Olalde Manuel and Olalde Norma H
Current Estimated Value
Home Financials for this Owner
Home Financials are based on the most recent Mortgage that was taken out on this home.
Original Mortgage
$33,950
Outstanding Balance
$12,478
Interest Rate
6.98%
Estimated Equity
$201,037
Create a Home Valuation Report for This Property
The Home Valuation Report is an in-depth analysis detailing your home's value as well as a comparison with similar homes in the area
Home Values in the Area
Average Home Value in this Area
Purchase History
| Date | Buyer | Sale Price | Title Company |
|---|---|---|---|
| Olalde Manuel | -- | -- |
Source: Public Records
Mortgage History
| Date | Status | Borrower | Loan Amount |
|---|---|---|---|
| Open | Olalde Manuel | $33,950 |
Source: Public Records
Tax History Compared to Growth
Tax History
| Year | Tax Paid | Tax Assessment Tax Assessment Total Assessment is a certain percentage of the fair market value that is determined by local assessors to be the total taxable value of land and additions on the property. | Land | Improvement |
|---|---|---|---|---|
| 2025 | $1,121 | $179,499 | $105,230 | $74,269 |
| 2024 | $1,121 | $173,224 | $105,230 | $67,994 |
| 2023 | $1,121 | $171,845 | $91,303 | $80,542 |
| 2022 | $2,077 | $137,442 | $68,090 | $69,352 |
| 2021 | $1,998 | $122,544 | $68,090 | $54,454 |
| 2020 | $1,888 | $115,593 | $68,090 | $47,503 |
| 2019 | $1,793 | $103,213 | $55,710 | $47,503 |
| 2018 | $1,009 | $77,307 | $38,688 | $38,619 |
| 2017 | $1,481 | $77,307 | $38,688 | $38,619 |
| 2016 | $1,346 | $77,307 | $38,688 | $38,619 |
| 2015 | $729 | $72,003 | $30,950 | $41,053 |
| 2014 | $729 | $65,122 | $21,665 | $43,457 |
Source: Public Records
Map
Nearby Homes
- 105 Oddo St
- 65 Neyland St
- 7014 Finn St
- 7018 Finn St
- 136 Theron St
- 164 Wallace St
- 7009 Amber St
- 249 Basswood St
- 7111 Bauman Rd
- 210 Van Molan St
- 715 E 34th St
- 0 E 31st St Unit 75519178
- 0 W Hardy St Unit 97848877
- 0 W Hardy St Unit 80694202
- 3111 Eastman St
- 0 Yorkshire St Unit 17401015
- 22 Stokes St
- 7015 Roswell St
- 311 & 309 Bennington St
- 1421 E 36th St