Estimated Value: $254,885 - $306,000
--
Bed
--
Bath
1,516
Sq Ft
$182/Sq Ft
Est. Value
About This Home
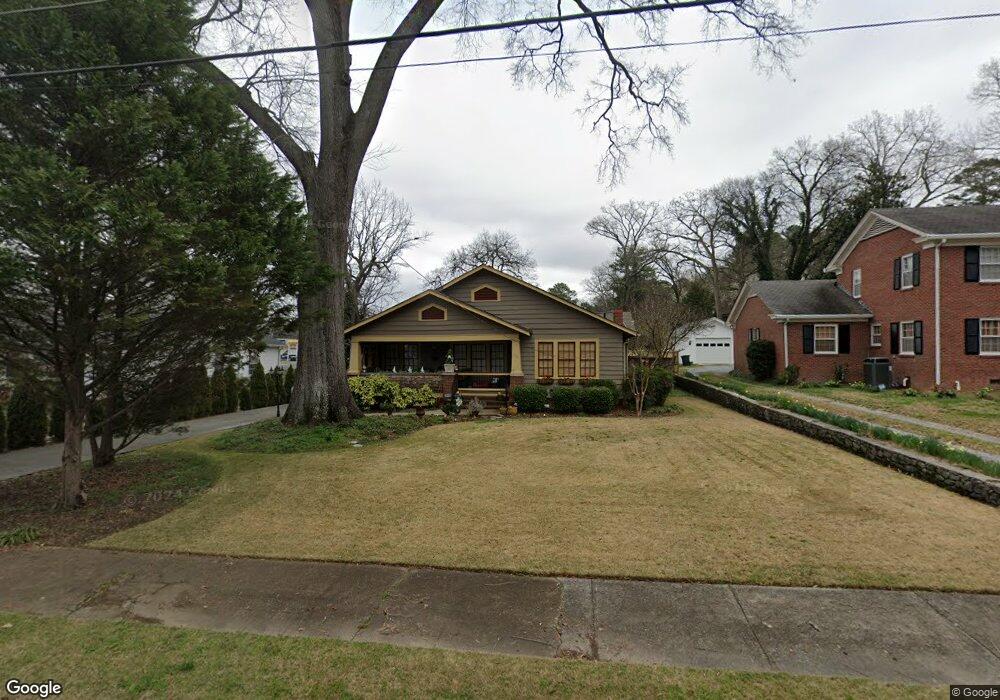
This home is located at 103 Westmore Rd SW, Rome, GA 30165 and is currently estimated at $275,221, approximately $181 per square foot. 103 Westmore Rd SW is a home located in Floyd County with nearby schools including Rome High School, St. Mary School, and Darlington School.
Ownership History
Date
Name
Owned For
Owner Type
Purchase Details
Closed on
Jun 9, 2006
Sold by
Not Provided
Bought by
Thomas Retchie and Thomas Mary K
Current Estimated Value
Purchase Details
Closed on
Jun 11, 2003
Sold by
Nicholson Linda Jane
Bought by
Trammell Linda J
Purchase Details
Closed on
Jul 18, 1994
Sold by
Morris Thorton W
Bought by
Nicholson Linda Jane
Purchase Details
Closed on
May 8, 1992
Bought by
P and R
Purchase Details
Closed on
Apr 6, 1984
Sold by
F N B As Trustee Of Trust Agree & Indent
Bought by
Morris Thorton W
Purchase Details
Closed on
Feb 9, 1984
Bought by
P and R
Purchase Details
Closed on
Nov 7, 1983
Sold by
Morris Scott J
Bought by
F N B As Trustee Of Trust Agree & Indent
Purchase Details
Closed on
Mar 27, 1980
Sold by
Morris Scott J
Bought by
Morris Scott J
Purchase Details
Closed on
Aug 21, 1963
Bought by
Morris Scott J
Create a Home Valuation Report for This Property
The Home Valuation Report is an in-depth analysis detailing your home's value as well as a comparison with similar homes in the area
Home Values in the Area
Average Home Value in this Area
Purchase History
| Date | Buyer | Sale Price | Title Company |
|---|---|---|---|
| Thomas Retchie | $170,500 | -- | |
| Trammell Linda J | -- | -- | |
| Nicholson Linda Jane | $67,000 | -- | |
| P | -- | -- | |
| Morris Thorton W | $31,000 | -- | |
| P | -- | -- | |
| F N B As Trustee Of Trust Agree & Indent | -- | -- | |
| Morris Scott J | -- | -- | |
| Morris Scott J | -- | -- |
Source: Public Records
Tax History Compared to Growth
Tax History
| Year | Tax Paid | Tax Assessment Tax Assessment Total Assessment is a certain percentage of the fair market value that is determined by local assessors to be the total taxable value of land and additions on the property. | Land | Improvement |
|---|---|---|---|---|
| 2024 | $1,947 | $82,402 | $13,992 | $68,410 |
| 2023 | $1,926 | $86,976 | $12,720 | $74,256 |
| 2022 | $1,828 | $73,344 | $10,494 | $62,850 |
| 2021 | $1,761 | $67,584 | $10,494 | $57,090 |
| 2020 | $2,584 | $70,372 | $7,950 | $62,422 |
| 2019 | $2,435 | $67,064 | $7,950 | $59,114 |
| 2018 | $2,314 | $63,801 | $7,950 | $55,851 |
| 2017 | $2,228 | $61,456 | $7,950 | $53,506 |
| 2016 | $2,185 | $60,120 | $7,920 | $52,200 |
| 2015 | $2,054 | $59,840 | $7,920 | $51,920 |
| 2014 | $2,054 | $59,840 | $7,920 | $51,920 |
Source: Public Records
Map
Nearby Homes
- 209 Sherwood Rd SW
- 17 Rosewood Rd SW
- 9 Shorter Cir SW
- 19 Berckman Ln SW
- 3 Berckman Ln SW
- 14 Berckman Ln SW
- 13 Ridgewood Rd SW
- 0 Mount Alto Rd SW Unit 10523740
- 8 S Hughes St SW
- 6 Horseleg Creek Rd SW
- 0 Unbridled Rd Unit 22 23074684
- 16 Wilkerson Rd SW
- 124 Sheridan Dr NW
- 1005 N 2nd Ave NW Unit 39
- PEARSON Plan at Shorter Village
- 23 Sweetspire Dr NW
- 21 Sweetspire Dr NW
- 17 Wilkerson Rd SW
- 2 Wayne St SW
- 4 Wayne St SW
- 105 Westmore Rd SW
- 107 Westmore Rd SW
- 213 Sherwood Rd SW
- 104 Westmore Rd SW
- 102 Westmore Rd SW
- 106 Westmore Rd SW
- 109 Westmore Rd SW
- 0 Westmore Rd SW Unit 7434647
- 0 Westmore Rd SW Unit 8701538
- 0 Westmore Rd SW Unit 8536850
- 0 Westmore Rd SW Unit 8302022
- 0 Westmore Rd SW Unit 8145013
- 0 Westmore Rd SW Unit 8093511
- 0 Westmore Rd SW Unit 8061278
- 0 Westmore Rd SW Unit 8185676
- 0 Westmore Rd SW Unit 8647269
- 0 Westmore Rd SW Unit 8958408
- 0 Westmore Rd SW Unit 8974402
- 0 Westmore Rd SW Unit 8994801
- 0 Westmore Rd SW Unit 8827843