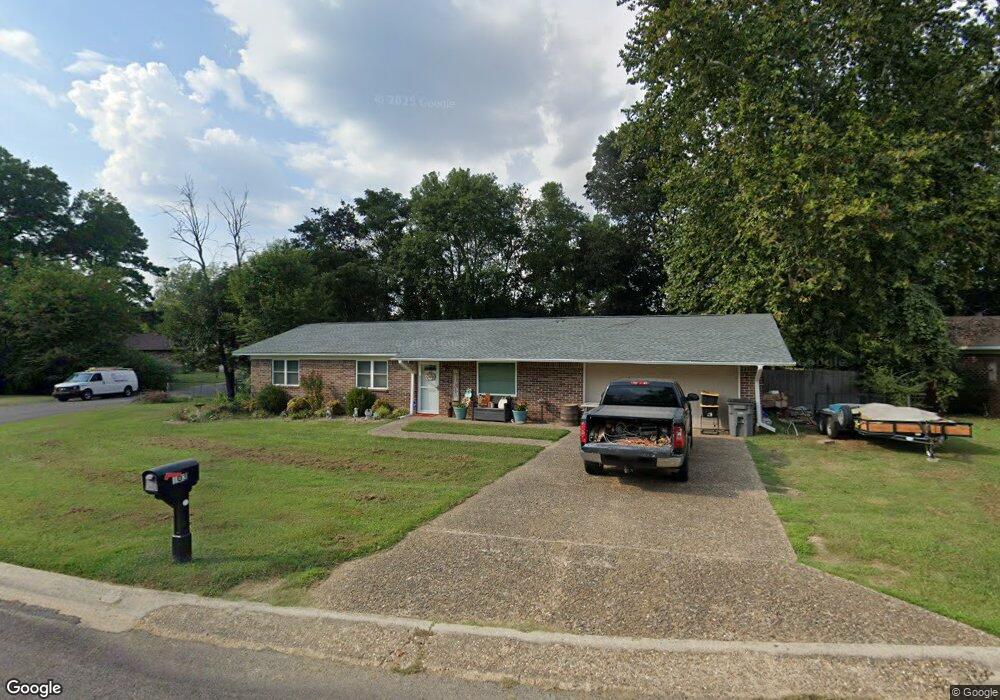
103 Whitepines Ct Hot Springs National Park, AR 71901
Estimated Value: $186,290 - $226,000
3
Beds
2
Baths
1,296
Sq Ft
$157/Sq Ft
Est. Value
About This Home
This home is located at 103 Whitepines Ct, Hot Springs National Park, AR 71901 and is currently estimated at $203,823, approximately $157 per square foot. 103 Whitepines Ct is a home located in Garland County with nearby schools including Lakeside Primary School, Lakeside Intermediate School, and Lakeside Junior High School.
Ownership History
Date
Name
Owned For
Owner Type
Purchase Details
Closed on
Oct 1, 2020
Sold by
Mcclard Cheryle and Mcclard Fred
Bought by
Mcclard Cheryle and Mcclard Fred
Current Estimated Value
Purchase Details
Closed on
Jul 1, 2020
Sold by
Ward Barbara G
Bought by
Mcclard Cheryle
Home Financials for this Owner
Home Financials are based on the most recent Mortgage that was taken out on this home.
Original Mortgage
$110,000
Outstanding Balance
$97,323
Interest Rate
3.1%
Mortgage Type
New Conventional
Estimated Equity
$106,500
Purchase Details
Closed on
Jun 16, 1999
Sold by
Not Provided
Bought by
Ward Barbara G
Purchase Details
Closed on
Aug 26, 1994
Sold by
Not Provided
Bought by
Dennis Vivian M and Dennis Robert H
Purchase Details
Closed on
Aug 25, 1994
Sold by
Not Provided
Bought by
Keaton Craig and Keaton Tracy
Purchase Details
Closed on
Jan 1, 1901
Bought by
Sanders Charles R and 103 White Pine
Create a Home Valuation Report for This Property
The Home Valuation Report is an in-depth analysis detailing your home's value as well as a comparison with similar homes in the area
Home Values in the Area
Average Home Value in this Area
Purchase History
| Date | Buyer | Sale Price | Title Company |
|---|---|---|---|
| Mcclard Cheryle | -- | None Available | |
| Mcclard Cheryle | $137,500 | Realty Title | |
| Ward Barbara G | $70,000 | -- | |
| Dennis Vivian M | -- | -- | |
| Keaton Craig | $63,000 | -- | |
| Not Provided | $51,000 | -- | |
| Sanders Charles R | -- | -- |
Source: Public Records
Mortgage History
| Date | Status | Borrower | Loan Amount |
|---|---|---|---|
| Open | Mcclard Cheryle | $110,000 |
Source: Public Records
Tax History Compared to Growth
Tax History
| Year | Tax Paid | Tax Assessment Tax Assessment Total Assessment is a certain percentage of the fair market value that is determined by local assessors to be the total taxable value of land and additions on the property. | Land | Improvement |
|---|---|---|---|---|
| 2025 | $543 | $30,420 | $1,800 | $28,620 |
| 2024 | $581 | $30,420 | $1,800 | $28,620 |
| 2023 | $609 | $30,420 | $1,800 | $28,620 |
| 2022 | $987 | $30,420 | $1,800 | $28,620 |
| 2021 | $948 | $20,930 | $1,900 | $19,030 |
| 2020 | $573 | $20,930 | $1,900 | $19,030 |
| 2019 | $573 | $20,930 | $1,900 | $19,030 |
| 2018 | $573 | $20,930 | $1,900 | $19,030 |
| 2017 | $527 | $20,930 | $1,900 | $19,030 |
| 2016 | $485 | $19,020 | $2,280 | $16,740 |
| 2015 | $436 | $19,020 | $2,280 | $16,740 |
| 2014 | $435 | $19,020 | $2,280 | $16,740 |
Source: Public Records
Map
Nearby Homes
- 423 Pine Meadows Loop
- 105 Whitepines Ct
- 421 Pine Meadows Loop
- 104 Whitepines Ct
- 106 Whitepines Ct
- 107 Whitepines Pine Meadows Loop
- 425 Pine Meadows Loop
- 107 Whitepines Ct
- 419 Pine Meadows Loop
- 109 Whitepines Ct
- 102 Pine Meadows Loop
- 420 Pine Meadows Loop
- 422 Pine Meadows Loop
- 104 Pine Meadows
- 417 Pine Meadows Loop Unit 387 Joy Dr
- 417 Pine Meadows Loop
- 100 Pine Meadows Loop
- 424 Pine Meadows Loop
- 424 Pine Meadows
- 424 Pine Meadows Loop Meadows