Estimated Value: $88,000 - $121,000
--
Bed
1
Bath
988
Sq Ft
$103/Sq Ft
Est. Value
About This Home
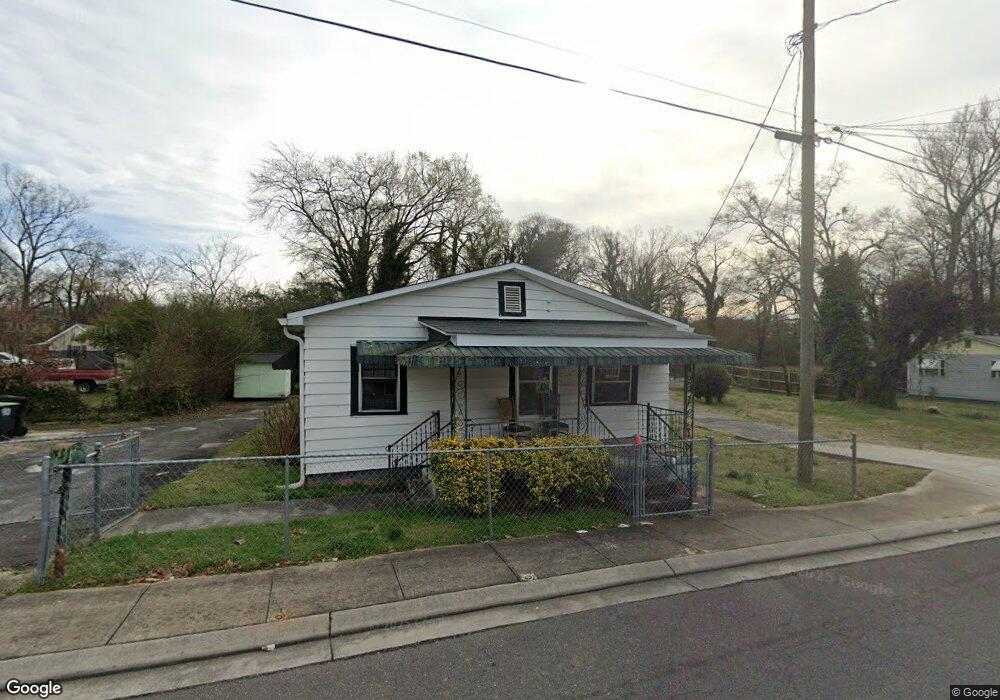
This home is located at 103 Wilson Ave SW, Rome, GA 30161 and is currently estimated at $101,385, approximately $102 per square foot. 103 Wilson Ave SW is a home located in Floyd County with nearby schools including Dan McCarty Middle School, Rome High School, and Darlington School.
Ownership History
Date
Name
Owned For
Owner Type
Purchase Details
Closed on
Oct 24, 2019
Sold by
Sellers Evell Dixon Estate
Bought by
Sellers Curtis
Current Estimated Value
Purchase Details
Closed on
Jun 22, 2006
Sold by
Not Provided
Bought by
Sellers Evell
Purchase Details
Closed on
Jan 8, 1998
Sold by
Sellers Kisar
Bought by
Sellers Kisar and Evell Sellers
Purchase Details
Closed on
Apr 1, 1981
Sold by
Camp Mary B
Bought by
Sellers Kisar
Purchase Details
Closed on
Mar 13, 1981
Bought by
P and R
Purchase Details
Closed on
Mar 11, 1981
Bought by
P and R
Purchase Details
Closed on
Mar 10, 1981
Sold by
Shell Home Builders Inc
Bought by
Camp Mary B
Purchase Details
Closed on
Jan 1, 1981
Bought by
P and R
Purchase Details
Closed on
Nov 8, 1979
Sold by
Ervin Evander
Bought by
Shell Home Builders Inc
Purchase Details
Closed on
Nov 7, 1979
Bought by
Ervin Evander
Create a Home Valuation Report for This Property
The Home Valuation Report is an in-depth analysis detailing your home's value as well as a comparison with similar homes in the area
Home Values in the Area
Average Home Value in this Area
Purchase History
| Date | Buyer | Sale Price | Title Company |
|---|---|---|---|
| Sellers Curtis | -- | -- | |
| Sellers Evell | -- | -- | |
| Sellers Kisar | -- | -- | |
| Sellers Kisar | -- | -- | |
| P | -- | -- | |
| P | -- | -- | |
| Camp Mary B | -- | -- | |
| P | -- | -- | |
| Shell Home Builders Inc | -- | -- | |
| Ervin Evander | -- | -- |
Source: Public Records
Tax History Compared to Growth
Tax History
| Year | Tax Paid | Tax Assessment Tax Assessment Total Assessment is a certain percentage of the fair market value that is determined by local assessors to be the total taxable value of land and additions on the property. | Land | Improvement |
|---|---|---|---|---|
| 2024 | $767 | $19,640 | $6,996 | $12,644 |
| 2023 | $696 | $18,457 | $6,360 | $12,097 |
| 2022 | $546 | $14,972 | $5,088 | $9,884 |
| 2021 | $440 | $11,846 | $5,088 | $6,758 |
| 2020 | $385 | $10,302 | $3,975 | $6,327 |
| 2019 | $366 | $9,881 | $3,975 | $5,906 |
| 2018 | $136 | $9,391 | $3,975 | $5,416 |
| 2017 | $132 | $9,147 | $3,975 | $5,172 |
| 2016 | $166 | $10,862 | $3,960 | $6,902 |
| 2015 | $146 | $10,862 | $3,960 | $6,902 |
| 2014 | $146 | $10,862 | $3,960 | $6,902 |
Source: Public Records
Map
Nearby Homes
- 101 Hardy Ave SW
- 218 Wilson Ave SW
- 204 Myrtle St SW
- 334 Branham Ave SW
- 110 Cherokee St SW
- 410 Hardy Ave SW
- 105 Mary St SW
- 3 Grover St SW
- 232 S Broad St SW
- 107 Butler St SW
- 18 Butler St SW
- 515 Harper Ave SW
- 3 Porter St SW
- 529 Branham Ave SW
- 515 S Broad St SW
- 115 Lookout Cir SW
- 113 Lookout Cir SW
- 111 Lookout Cir SW
- 6 Horseleg Creek Rd SW
- 105 Wilson Ave SW
- 107 Wilson Ave SW
- 505 Myrtle St SW
- 505 Myrtle St SW
- 104 Wilson Ave SW
- 102 Wilson Ave SW
- 106 Wilson Ave SW
- 503 Myrtle St SW
- 104 Nixon Ave SW
- 100 Wilson Ave SW
- 108 Wilson Ave SW
- 106 Nixon Ave SW
- 111 Wilson Ave SW
- 501 Myrtle St SW
- 110 Wilson Ave SW
- 32 Virginia Cir SW
- 108 Nixon Ave SW
- 29 Virginia Cir SW
- 112 Wilson Ave SW
- 106 Charles St SW