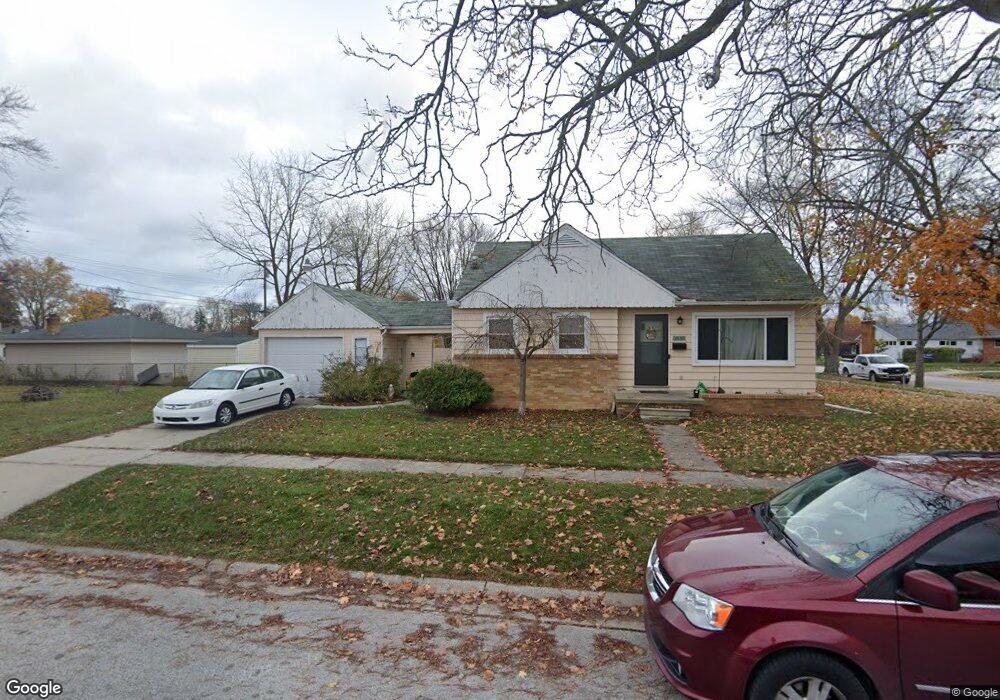
1030 19th St Unit Bldg-Unit Port Huron, MI 48060
Estimated Value: $144,000 - $170,063
2
Beds
2
Baths
832
Sq Ft
$187/Sq Ft
Est. Value
About This Home
This home is located at 1030 19th St Unit Bldg-Unit, Port Huron, MI 48060 and is currently estimated at $155,516, approximately $186 per square foot. 1030 19th St Unit Bldg-Unit is a home located in St. Clair County with nearby schools including Michigamme Elementary School, Central Middle School, and Port Huron High School.
Ownership History
Date
Name
Owned For
Owner Type
Purchase Details
Closed on
Jun 19, 2018
Sold by
Molly Mcintyre
Bought by
Rodgers Jacqueline
Current Estimated Value
Home Financials for this Owner
Home Financials are based on the most recent Mortgage that was taken out on this home.
Original Mortgage
$77,503
Outstanding Balance
$66,886
Interest Rate
4.5%
Mortgage Type
New Conventional
Estimated Equity
$88,630
Create a Home Valuation Report for This Property
The Home Valuation Report is an in-depth analysis detailing your home's value as well as a comparison with similar homes in the area
Home Values in the Area
Average Home Value in this Area
Purchase History
| Date | Buyer | Sale Price | Title Company |
|---|---|---|---|
| Rodgers Jacqueline | $79,900 | None Listed On Document |
Source: Public Records
Mortgage History
| Date | Status | Borrower | Loan Amount |
|---|---|---|---|
| Open | Rodgers Jacqueline | $77,503 | |
| Closed | Rodgers Jacqueline | $6,000 |
Source: Public Records
Tax History Compared to Growth
Tax History
| Year | Tax Paid | Tax Assessment Tax Assessment Total Assessment is a certain percentage of the fair market value that is determined by local assessors to be the total taxable value of land and additions on the property. | Land | Improvement |
|---|---|---|---|---|
| 2025 | $2,275 | $72,600 | $0 | $0 |
| 2024 | $1,938 | $70,800 | $0 | $0 |
| 2023 | $1,831 | $63,900 | $0 | $0 |
| 2022 | $6,743 | $56,200 | $0 | $0 |
| 2021 | $2,112 | $51,100 | $0 | $0 |
| 2020 | $1,848 | $46,500 | $46,500 | $0 |
| 2019 | $1,816 | $33,100 | $0 | $0 |
| 2018 | $1,714 | $33,100 | $0 | $0 |
| 2017 | $1,097 | $28,600 | $0 | $0 |
| 2016 | $931 | $28,600 | $0 | $0 |
| 2015 | $789 | $25,900 | $25,900 | $0 |
| 2014 | $789 | $22,000 | $22,000 | $0 |
| 2013 | -- | $22,000 | $0 | $0 |
Source: Public Records
Map
Nearby Homes