Estimated Value: $683,962 - $703,000
3
Beds
3
Baths
2,529
Sq Ft
$274/Sq Ft
Est. Value
About This Home
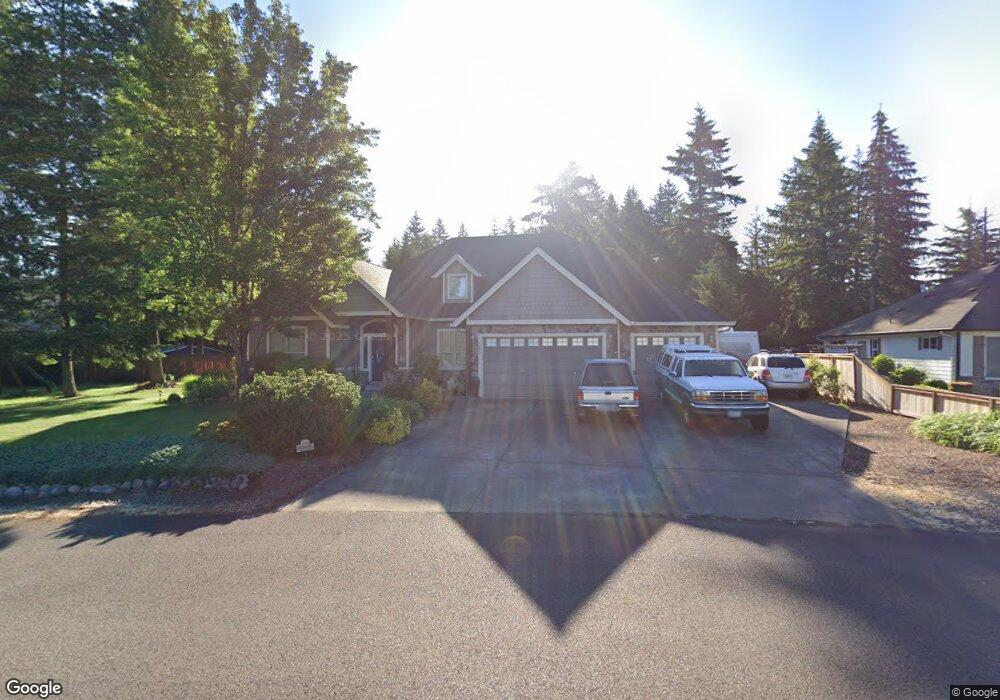
This home is located at 1030 7th St, Lyons, OR 97358 and is currently estimated at $693,481, approximately $274 per square foot. 1030 7th St is a home located in Linn County with nearby schools including Mari-Linn Elementary School and Stayton High School.
Ownership History
Date
Name
Owned For
Owner Type
Purchase Details
Closed on
Feb 26, 2020
Sold by
Ninman Gary M and Ninman Sarah C
Bought by
Whisman Eric D and Whisman Tonia J
Current Estimated Value
Home Financials for this Owner
Home Financials are based on the most recent Mortgage that was taken out on this home.
Original Mortgage
$300,000
Outstanding Balance
$198,953
Interest Rate
3.6%
Mortgage Type
New Conventional
Estimated Equity
$494,528
Purchase Details
Closed on
Oct 17, 2008
Sold by
Pacific Construction Inc
Bought by
Ninman Gary M and Ninman Sarah C
Home Financials for this Owner
Home Financials are based on the most recent Mortgage that was taken out on this home.
Original Mortgage
$378,000
Interest Rate
6.31%
Mortgage Type
Purchase Money Mortgage
Purchase Details
Closed on
Sep 18, 2007
Sold by
Jdc Homes Llc
Bought by
Pacific Construction Inc
Create a Home Valuation Report for This Property
The Home Valuation Report is an in-depth analysis detailing your home's value as well as a comparison with similar homes in the area
Purchase History
| Date | Buyer | Sale Price | Title Company |
|---|---|---|---|
| Whisman Eric D | $498,000 | First American | |
| Ninman Gary M | $420,000 | Fidelity Natl Title Co Of Or | |
| Pacific Construction Inc | -- | Fidelity Natl Title Co Of Or |
Source: Public Records
Mortgage History
| Date | Status | Borrower | Loan Amount |
|---|---|---|---|
| Open | Whisman Eric D | $300,000 | |
| Previous Owner | Ninman Gary M | $378,000 |
Source: Public Records
Tax History
| Year | Tax Paid | Tax Assessment Tax Assessment Total Assessment is a certain percentage of the fair market value that is determined by local assessors to be the total taxable value of land and additions on the property. | Land | Improvement |
|---|---|---|---|---|
| 2025 | $6,402 | $434,740 | -- | -- |
| 2024 | $6,195 | $422,080 | -- | -- |
| 2023 | $6,059 | $409,790 | $0 | $0 |
| 2022 | $5,830 | $397,860 | $0 | $0 |
| 2021 | $5,601 | $386,280 | $0 | $0 |
| 2020 | $5,487 | $375,030 | $0 | $0 |
| 2019 | $5,356 | $364,110 | $0 | $0 |
| 2018 | $5,259 | $353,510 | $0 | $0 |
| 2017 | $5,119 | $343,220 | $0 | $0 |
| 2016 | $4,975 | $333,230 | $0 | $0 |
| 2015 | $4,802 | $323,530 | $0 | $0 |
| 2014 | $4,658 | $314,110 | $0 | $0 |
Source: Public Records
Map
Nearby Homes
- 950 6th St
- 628 N 13th St
- 0002317 E Dogwood Dr (Next To)
- E Dogwood Dr (Next To) St
- 11294 Mehama Heights
- 636 Birch St
- 442 Cedar St
- 534 Birch St
- 11133 Riverwood Dr SE
- 247 Cedar St
- 817 Main St
- 21991 Fern Ridge Rd SE
- 22986 N Fork Rd SE
- 11193 Kathy Ln SE
- 1611 Main St
- 40850 16th St
- 11177 Stockpile Ln SE
- 45849 River Loop
- 2240 Apple Loop
- 2426 Oak St
Your Personal Tour Guide
Ask me questions while you tour the home.