Estimated Value: $91,611 - $169,000
2
Beds
1
Bath
1,198
Sq Ft
$108/Sq Ft
Est. Value
About This Home
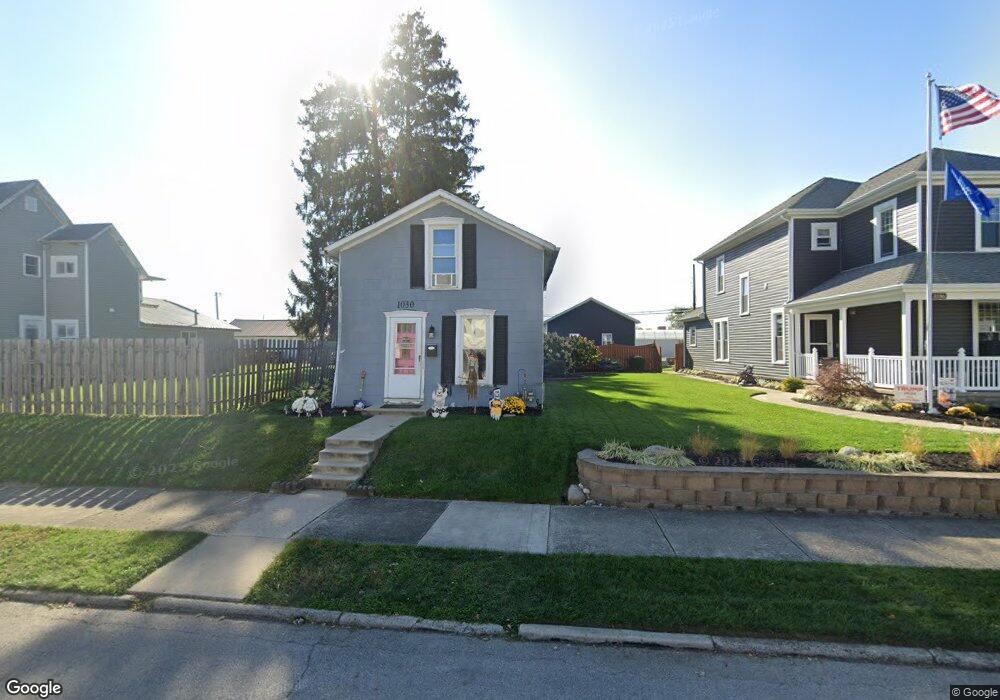
This home is located at 1030 Broadway, Piqua, OH 45356 and is currently estimated at $129,653, approximately $108 per square foot. 1030 Broadway is a home located in Miami County with nearby schools including Piqua Central Intermediate School, Springcreek Primary School, and Piqua Junior High School.
Ownership History
Date
Name
Owned For
Owner Type
Purchase Details
Closed on
Jun 10, 2016
Sold by
The Bank Of New York Mellon
Bought by
Walters Jams
Current Estimated Value
Purchase Details
Closed on
May 23, 2016
Sold by
Bradley Luann M and Bradley Luann
Bought by
Centex Home Equity Loan Trust 2005-C
Purchase Details
Closed on
Apr 30, 2016
Sold by
Bradley Luann M and Bradley Luann
Bought by
The Centex Home Equity Loan Trust 2005-C
Purchase Details
Closed on
May 16, 2001
Sold by
Bradley Scott L
Bought by
Bradley Luann M
Purchase Details
Closed on
Aug 1, 1988
Bought by
Bradley Scott L
Create a Home Valuation Report for This Property
The Home Valuation Report is an in-depth analysis detailing your home's value as well as a comparison with similar homes in the area
Home Values in the Area
Average Home Value in this Area
Purchase History
| Date | Buyer | Sale Price | Title Company |
|---|---|---|---|
| Walters Jams | $19,001 | Attorney | |
| Centex Home Equity Loan Trust 2005-C | $28,000 | None Available | |
| The Centex Home Equity Loan Trust 2005-C | $28,000 | Attorney | |
| Bradley Luann M | -- | -- | |
| Bradley Scott L | $41,000 | -- |
Source: Public Records
Tax History Compared to Growth
Tax History
| Year | Tax Paid | Tax Assessment Tax Assessment Total Assessment is a certain percentage of the fair market value that is determined by local assessors to be the total taxable value of land and additions on the property. | Land | Improvement |
|---|---|---|---|---|
| 2024 | $672 | $15,930 | $5,920 | $10,010 |
| 2023 | $672 | $15,930 | $5,920 | $10,010 |
| 2022 | $683 | $15,930 | $5,920 | $10,010 |
| 2021 | $410 | $8,760 | $4,730 | $4,030 |
| 2020 | $403 | $8,760 | $4,730 | $4,030 |
| 2019 | $405 | $8,760 | $4,730 | $4,030 |
| 2018 | $684 | $14,110 | $4,730 | $9,380 |
| 2017 | $692 | $14,110 | $4,730 | $9,380 |
| 2016 | $666 | $14,110 | $4,730 | $9,380 |
| 2015 | $656 | $13,580 | $4,550 | $9,030 |
| 2014 | $656 | $13,580 | $4,550 | $9,030 |
| 2013 | $659 | $13,580 | $4,550 | $9,030 |
Source: Public Records
Map
Nearby Homes