Estimated Value: $442,000 - $491,000
4
Beds
4
Baths
3,490
Sq Ft
$135/Sq Ft
Est. Value
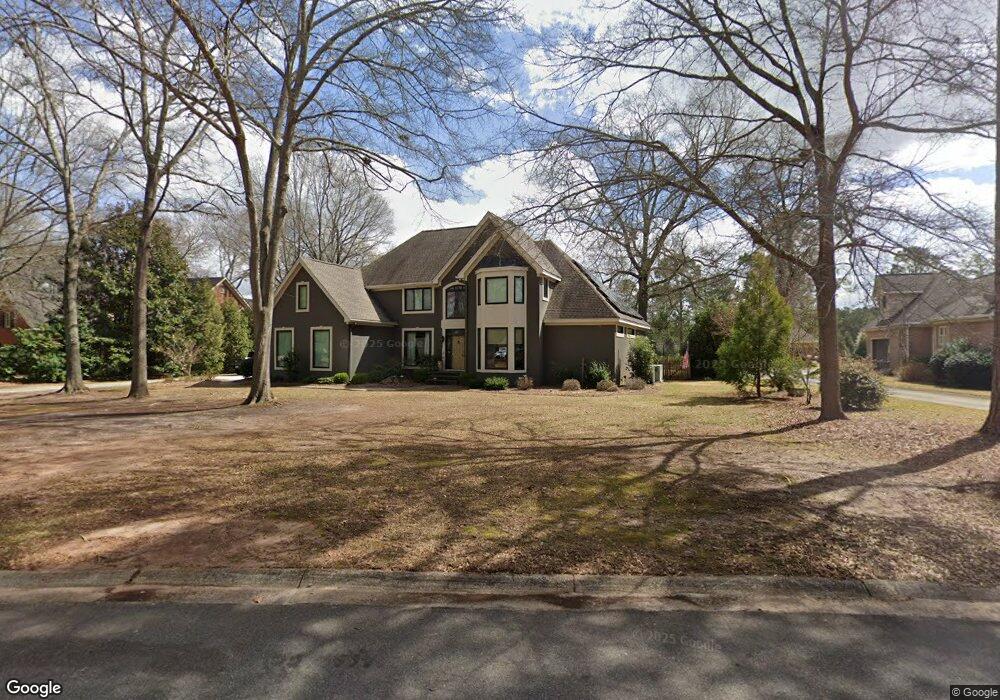
About This Home
This home is located at 1030 Cherokee Rd, Perry, GA 31069 and is currently estimated at $472,300, approximately $135 per square foot. 1030 Cherokee Rd is a home located in Houston County with nearby schools including Morningside Elementary School, Perry Middle School, and Perry High School.
Ownership History
Date
Name
Owned For
Owner Type
Purchase Details
Closed on
May 22, 2023
Sold by
Velasquez Jonathan G
Bought by
Velasquez Sarah P
Current Estimated Value
Purchase Details
Closed on
Jul 11, 2018
Sold by
Cherokee Pines Golf & Fitness Club Inc
Bought by
Velasquez Jonathan G and Velasquez Sara P
Purchase Details
Closed on
May 31, 2005
Sold by
Security Bank Of Houston County
Bought by
Velasquez Jonathan G and Velasquez Sara P
Home Financials for this Owner
Home Financials are based on the most recent Mortgage that was taken out on this home.
Original Mortgage
$175,000
Interest Rate
5.74%
Mortgage Type
New Conventional
Purchase Details
Closed on
Sep 2, 2003
Sold by
Harrison Robert W and Harrison Mary Lynn
Bought by
Security Bank Of Houston County
Purchase Details
Closed on
Oct 6, 1994
Sold by
Crowe John B and Crowe Betty W
Bought by
Harrison Robert W and Mary L*
Purchase Details
Closed on
Mar 6, 1990
Sold by
Northside Perry Ltd
Bought by
Crowe John B and Crowe Betty W
Create a Home Valuation Report for This Property
The Home Valuation Report is an in-depth analysis detailing your home's value as well as a comparison with similar homes in the area
Home Values in the Area
Average Home Value in this Area
Purchase History
| Date | Buyer | Sale Price | Title Company |
|---|---|---|---|
| Velasquez Sarah P | -- | None Listed On Document | |
| Velasquez Jonathan G | $10,400 | None Available | |
| Velasquez Jonathan G | $290,000 | None Available | |
| Security Bank Of Houston County | $220,000 | None Available | |
| Security Bank Of Houston County | $220,000 | -- | |
| Harrison Robert W | $219,000 | -- | |
| Crowe John B | -- | -- |
Source: Public Records
Mortgage History
| Date | Status | Borrower | Loan Amount |
|---|---|---|---|
| Previous Owner | Velasquez Jonathan G | $175,000 |
Source: Public Records
Tax History
| Year | Tax Paid | Tax Assessment Tax Assessment Total Assessment is a certain percentage of the fair market value that is determined by local assessors to be the total taxable value of land and additions on the property. | Land | Improvement |
|---|---|---|---|---|
| 2025 | $5,532 | $169,560 | $19,800 | $149,760 |
| 2024 | $6,269 | $171,840 | $17,960 | $153,880 |
| 2023 | $5,191 | $141,560 | $17,960 | $123,600 |
| 2022 | $2,979 | $131,560 | $17,960 | $113,600 |
| 2021 | $2,762 | $121,480 | $17,960 | $103,520 |
| 2020 | $4,340 | $116,240 | $17,960 | $98,280 |
| 2019 | $2,654 | $116,240 | $17,960 | $98,280 |
| 2018 | $2,632 | $115,280 | $18,280 | $97,000 |
| 2017 | $2,634 | $115,280 | $18,280 | $97,000 |
| 2016 | $2,638 | $115,280 | $18,280 | $97,000 |
| 2015 | $2,655 | $115,760 | $18,280 | $97,480 |
| 2014 | -- | $115,760 | $18,280 | $97,480 |
| 2013 | -- | $115,760 | $18,280 | $97,480 |
Source: Public Records
Map
Nearby Homes
- 1015 Cherokee Rd
- 105 Eagles Ridge Ct
- 102 N Haven Ln
- 110 Gwendolyn Ave
- 112 Bainbridge Ln
- 206 Londie Ln
- 206 Londe Ln
- 1802 Houston Lake Rd
- 204 Sutton Dr
- 206 Sutton Dr
- 1729 Milton Way
- 207 Ensemble Blvd
- 110 Palmetto Ave
- 106 Raspberry Trail
- 101 Lighterknot Trail
- 102 Ridge Cir N
- 113 Billboard Ave
- 111 Billboard Ave
- 109 Billboard Ave
- 107 Billboard Ave
- 1028 Cherokee Rd
- 1032 Cherokee Rd
- 1026 Cherokee Rd
- 1027 Cherokee Rd
- 1025 Cherokee Rd
- 1029 Cherokee Rd
- 1023 Cherokee Rd
- 1024 Cherokee Rd
- 1021 Cherokee Rd
- 307 Yorktown Dr
- 305 Yorktown Dr
- 309 Yorktown Dr
- 303 Yorktown Dr
- 401 Yorktown Dr
- 1031 Cherokee Rd
- 1019 Cherokee Rd
- 403 Yorktown Dr
- 301 Yorktown Dr
- 405 Yorktown Dr
- 201 Yorktown Dr
Your Personal Tour Guide
Ask me questions while you tour the home.