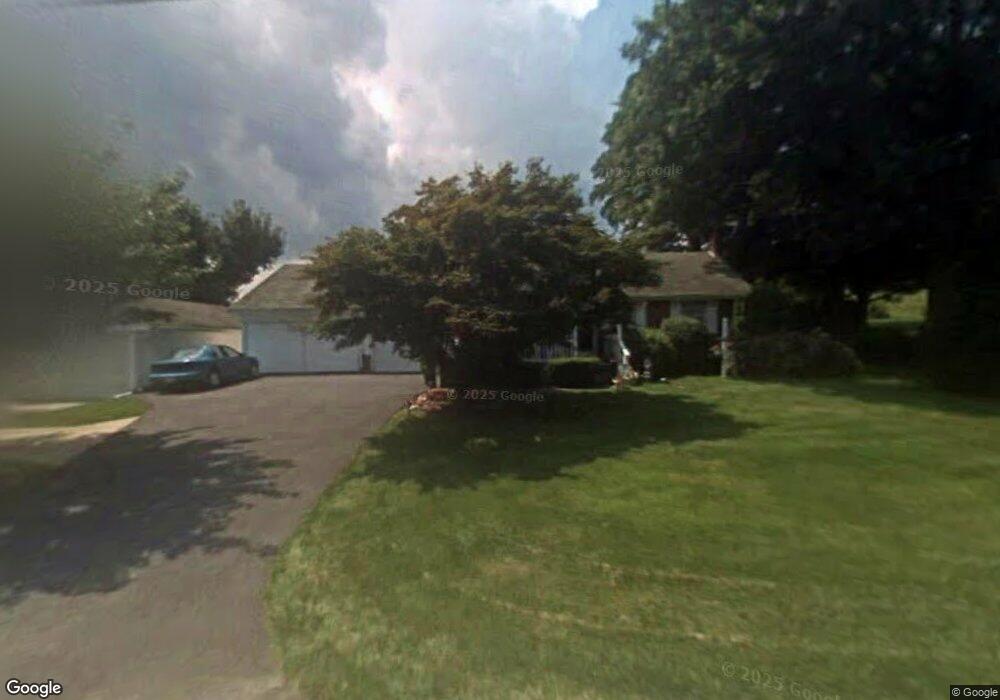
1030 Cross Keys Rd Leesport, PA 19533
Bern NeighborhoodEstimated Value: $238,000 - $287,000
3
Beds
1
Bath
988
Sq Ft
$256/Sq Ft
Est. Value
About This Home
This home is located at 1030 Cross Keys Rd, Leesport, PA 19533 and is currently estimated at $253,307, approximately $256 per square foot. 1030 Cross Keys Rd is a home located in Berks County with nearby schools including Schuylkill Valley Elementary School, Schuylkill Valley Middle School, and Schuylkill Valley High School.
Ownership History
Date
Name
Owned For
Owner Type
Purchase Details
Closed on
Jul 11, 2017
Sold by
Wayne Donald J
Bought by
Wayne Kim A
Current Estimated Value
Purchase Details
Closed on
Aug 6, 2013
Sold by
Wayne Donald J and Wayne Geraldine A
Bought by
Wayne Donald J
Purchase Details
Closed on
Jul 8, 2013
Sold by
Wayne Donald J and Wayne Geraldine A
Bought by
Wayne Donald J
Purchase Details
Closed on
Aug 24, 2007
Sold by
Ohlinger Scott H and Ohlinger Dawn M
Bought by
Ohlinger Scott H
Home Financials for this Owner
Home Financials are based on the most recent Mortgage that was taken out on this home.
Original Mortgage
$94,000
Interest Rate
6.26%
Mortgage Type
New Conventional
Purchase Details
Closed on
Aug 11, 1964
Bought by
Wayne Donald J and Wayne Geraldine A
Create a Home Valuation Report for This Property
The Home Valuation Report is an in-depth analysis detailing your home's value as well as a comparison with similar homes in the area
Home Values in the Area
Average Home Value in this Area
Purchase History
| Date | Buyer | Sale Price | Title Company |
|---|---|---|---|
| Wayne Kim A | -- | None Available | |
| Wayne Kim A | -- | None Available | |
| Wayne Donald J | -- | None Available | |
| Wayne Donald J | -- | None Available | |
| Ohlinger Scott H | -- | None Available | |
| Wayne Donald J | -- | -- |
Source: Public Records
Mortgage History
| Date | Status | Borrower | Loan Amount |
|---|---|---|---|
| Closed | Ohlinger Scott H | $94,000 |
Source: Public Records
Tax History Compared to Growth
Tax History
| Year | Tax Paid | Tax Assessment Tax Assessment Total Assessment is a certain percentage of the fair market value that is determined by local assessors to be the total taxable value of land and additions on the property. | Land | Improvement |
|---|---|---|---|---|
| 2025 | $1,230 | $79,200 | $22,600 | $56,600 |
| 2024 | $3,225 | $79,200 | $22,600 | $56,600 |
| 2023 | $3,141 | $79,200 | $22,600 | $56,600 |
| 2022 | $3,141 | $79,200 | $22,600 | $56,600 |
| 2021 | $3,141 | $79,200 | $22,600 | $56,600 |
| 2020 | $3,141 | $79,200 | $22,600 | $56,600 |
| 2019 | $3,062 | $79,200 | $22,600 | $56,600 |
| 2018 | $3,062 | $79,200 | $22,600 | $56,600 |
| 2017 | $3,040 | $79,200 | $22,600 | $56,600 |
| 2016 | $868 | $79,200 | $22,600 | $56,600 |
| 2015 | $868 | $79,200 | $22,600 | $56,600 |
| 2014 | $868 | $79,200 | $22,600 | $56,600 |
Source: Public Records
Map
Nearby Homes
- 731 W Main St
- 1030 Chestnut St
- Lot #4 Rickenbach Rd
- 32 Canal St
- 1064 Mahlon Dr
- 678 Schuylkill Hill Rd
- 0 Mahlon Dr
- 70 N Centre Ave
- 482 Data Rd
- 437 White Oak Ln
- 463 White Oak Ln
- 0 Woodland Dr
- 405 Indian Manor Dr
- 1645 Fairview Dr
- 332 Kindt Corner Rd
- 1041 River Crest Dr
- 5213 Stoudts Ferry Bridge Rd
- 1025 River Crest Dr
- 0 Mccoy Ln Unit PABK2064868
- 35 Berkley Park Rd
- 1043 Cross Keys Rd
- 1033 Cross Keys Rd
- 1078 Cross Keys Rd
- 1035 Cross Keys Rd
- 1038 Cross Keys Rd
- 1045 Cross Keys Rd
- 1029 Cross Keys Rd
- 1026 Cross Keys Rd
- 1046 Cross Keys Rd
- 1048 Cross Keys Rd
- 1055 Cross Keys Rd
- 1022 Cross Keys Rd
- 1010 Cross Keys Rd
- 1002 Cross Keys Rd
- 1062 Cross Keys Rd
- 716 Belfair Dr
- 864 W Main St
- 714 Belfair Dr
- 1646 W Leesport Rd
- 1644 W Leesport Rd