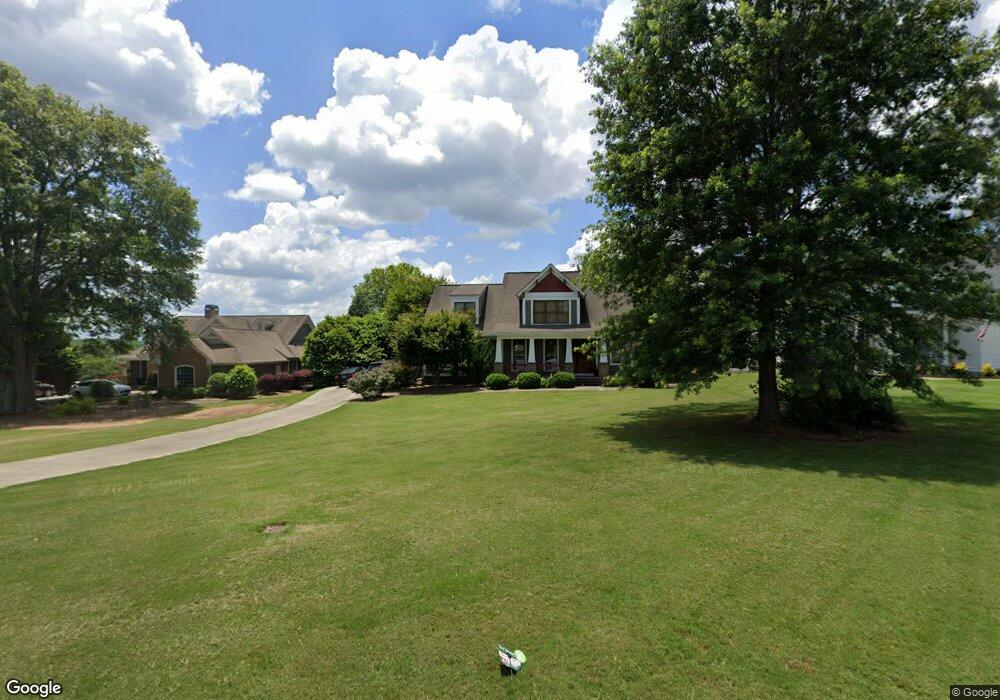
1030 Devon Dr Madison, GA 30650
Estimated Value: $520,378 - $631,000
Studio
--
Bath
2,952
Sq Ft
$200/Sq Ft
Est. Value
About This Home
This home is located at 1030 Devon Dr, Madison, GA 30650 and is currently estimated at $589,595, approximately $199 per square foot. 1030 Devon Dr is a home located in Morgan County with nearby schools including Morgan County Primary School, Morgan County Elementary School, and Morgan County Middle School.
Ownership History
Date
Name
Owned For
Owner Type
Purchase Details
Closed on
Oct 26, 2006
Sold by
Chamberlain Development Gr
Bought by
Pendergraft Dade G and Pendergraft Kathie D
Current Estimated Value
Home Financials for this Owner
Home Financials are based on the most recent Mortgage that was taken out on this home.
Original Mortgage
$210,000
Outstanding Balance
$122,691
Interest Rate
6.27%
Mortgage Type
New Conventional
Estimated Equity
$466,904
Purchase Details
Closed on
Dec 12, 2005
Sold by
Bank Of Madison
Bought by
Brd Development Co Llc
Home Financials for this Owner
Home Financials are based on the most recent Mortgage that was taken out on this home.
Original Mortgage
$296,547
Interest Rate
6.29%
Mortgage Type
New Conventional
Purchase Details
Closed on
Dec 8, 2005
Sold by
Brd Development Co Llc
Bought by
Chamberlain Development Grp In
Home Financials for this Owner
Home Financials are based on the most recent Mortgage that was taken out on this home.
Original Mortgage
$296,547
Interest Rate
6.29%
Mortgage Type
New Conventional
Create a Home Valuation Report for This Property
The Home Valuation Report is an in-depth analysis detailing your home's value as well as a comparison with similar homes in the area
Home Values in the Area
Average Home Value in this Area
Purchase History
| Date | Buyer | Sale Price | Title Company |
|---|---|---|---|
| Pendergraft Dade G | $352,830 | -- | |
| Brd Development Co Llc | -- | -- | |
| Chamberlain Development Grp In | $135,500 | -- |
Source: Public Records
Mortgage History
| Date | Status | Borrower | Loan Amount |
|---|---|---|---|
| Open | Pendergraft Dade G | $210,000 | |
| Previous Owner | Chamberlain Development Grp In | $296,547 |
Source: Public Records
Tax History
| Year | Tax Paid | Tax Assessment Tax Assessment Total Assessment is a certain percentage of the fair market value that is determined by local assessors to be the total taxable value of land and additions on the property. | Land | Improvement |
|---|---|---|---|---|
| 2025 | $3,881 | $199,704 | $22,000 | $177,704 |
| 2024 | $3,945 | $175,164 | $20,800 | $154,364 |
| 2023 | $3,661 | $157,795 | $20,800 | $136,995 |
| 2022 | $3,499 | $145,019 | $20,800 | $124,219 |
| 2021 | $3,365 | $139,019 | $14,800 | $124,219 |
| 2020 | $3,397 | $139,019 | $14,800 | $124,219 |
| 2019 | $3,452 | $139,019 | $14,800 | $124,219 |
| 2018 | $3,375 | $134,003 | $11,200 | $122,803 |
| 2017 | $3,226 | $124,527 | $11,400 | $113,127 |
| 2016 | $3,212 | $123,392 | $11,200 | $112,192 |
| 2015 | $3,102 | $117,760 | $11,200 | $106,560 |
| 2014 | $2,816 | $110,040 | $10,480 | $99,560 |
| 2013 | -- | $109,360 | $14,000 | $95,360 |
Source: Public Records
Map
Nearby Homes
- 2141 Greensboro Rd
- 2941 Old Buckhead Rd
- 1501 Turner Rd
- 0 Oak Ln Unit 10669405
- 1365 Veranda Park Dr
- 962 Saye Creek Dr
- 1355 Veranda Park Dr
- 1361 Arborgate St
- 1021 Windsor Creek Dr
- 568 New Post Rd
- 766 East Ave
- 679 College Dr
- 516 Hillside Rd
- 3854 Buckhead Rd
- 1060 Madison Hills Dr Unit 3
- 1040 Madison Hills Dr Unit 1
- 668 N Main St
- 0 Lions Club Rd Unit 10473699
- 1251 Boones Bridge Rd
- 356 N Main St
- 1040 Devon Dr
- 1020 Devon Dr
- 1050 Devon Dr
- 1131 Westminster Way
- 1161 Westminster Way
- 1151 Westminster Way
- 1031 Devon Dr
- 1041 Devon Dr
- 1060 Devon Dr
- 1021 Devon Dr
- 1051 Devon Dr
- 1181 Westminster Way
- 1011 Devon Dr
- 1011 Devon Dr Unit 11
- 1750 Westminster Way Unit 23
- 1750 Westminster Way
- 1061 Devon Dr
- 1191 Westminster Way
- 1111 Westminster Way
- 1760 Westminster Way
Your Personal Tour Guide
Ask me questions while you tour the home.