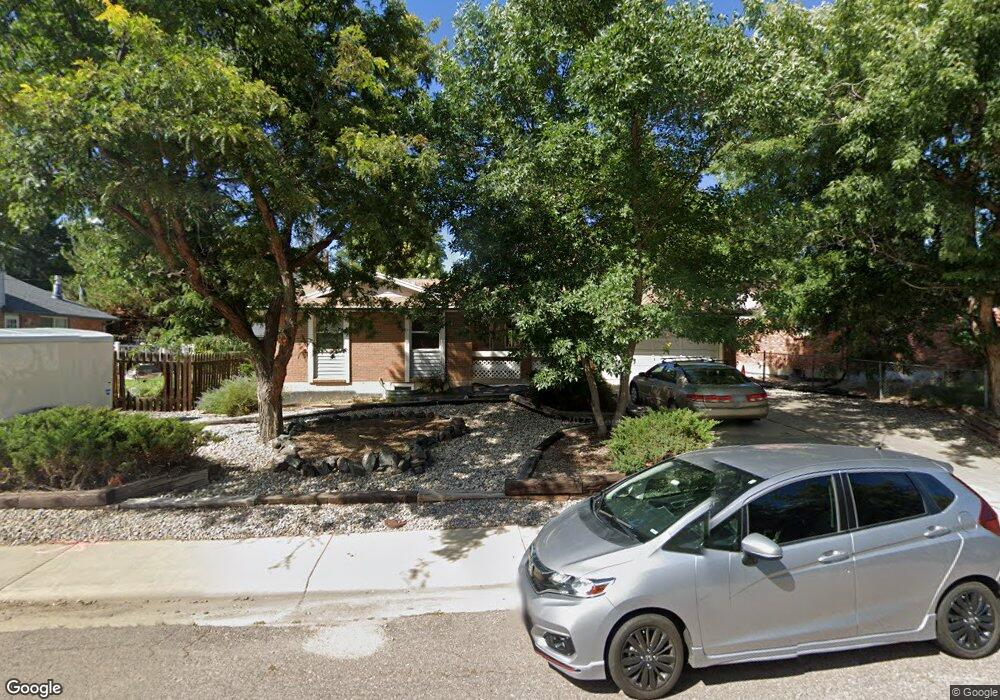
1030 Flint Way Broomfield, CO 80020
Broomfield Heights NeighborhoodEstimated Value: $541,000 - $617,000
4
Beds
3
Baths
2,858
Sq Ft
$202/Sq Ft
Est. Value
About This Home
This home is located at 1030 Flint Way, Broomfield, CO 80020 and is currently estimated at $576,157, approximately $201 per square foot. 1030 Flint Way is a home located in Broomfield County with nearby schools including Kohl Elementary School, Broomfield Heights Middle School, and Broomfield High School.
Ownership History
Date
Name
Owned For
Owner Type
Purchase Details
Closed on
Jul 21, 2010
Sold by
Hsbc Bank Usa National Association
Bought by
Zubella Charkes P
Current Estimated Value
Home Financials for this Owner
Home Financials are based on the most recent Mortgage that was taken out on this home.
Original Mortgage
$17,710
Outstanding Balance
$9,347
Interest Rate
4.54%
Mortgage Type
Credit Line Revolving
Estimated Equity
$566,810
Purchase Details
Closed on
Apr 30, 2010
Sold by
Haus Michael D
Bought by
Hsbc Bank Usa National Association
Purchase Details
Closed on
Aug 13, 2004
Sold by
Schifano Cecelia R
Bought by
Haus Michael D and Haus Giselle M Coffee
Home Financials for this Owner
Home Financials are based on the most recent Mortgage that was taken out on this home.
Original Mortgage
$211,500
Interest Rate
7.8%
Mortgage Type
Purchase Money Mortgage
Purchase Details
Closed on
Aug 22, 1994
Purchase Details
Closed on
Apr 18, 1974
Create a Home Valuation Report for This Property
The Home Valuation Report is an in-depth analysis detailing your home's value as well as a comparison with similar homes in the area
Home Values in the Area
Average Home Value in this Area
Purchase History
| Date | Buyer | Sale Price | Title Company |
|---|---|---|---|
| Zubella Charkes P | $177,100 | Cat | |
| Hsbc Bank Usa National Association | -- | None Available | |
| Haus Michael D | $235,000 | Stewart Title Of Denver Inc | |
| -- | $135,900 | -- | |
| -- | $37,700 | -- |
Source: Public Records
Mortgage History
| Date | Status | Borrower | Loan Amount |
|---|---|---|---|
| Open | Zubella Charkes P | $17,710 | |
| Previous Owner | Haus Michael D | $211,500 |
Source: Public Records
Tax History Compared to Growth
Tax History
| Year | Tax Paid | Tax Assessment Tax Assessment Total Assessment is a certain percentage of the fair market value that is determined by local assessors to be the total taxable value of land and additions on the property. | Land | Improvement |
|---|---|---|---|---|
| 2025 | $3,189 | $37,770 | $9,050 | $28,720 |
| 2024 | $3,189 | $34,030 | $8,160 | $25,870 |
| 2023 | $3,182 | $40,700 | $9,380 | $31,320 |
| 2022 | $2,780 | $28,760 | $6,600 | $22,160 |
| 2021 | $2,766 | $29,590 | $6,790 | $22,800 |
| 2020 | $2,496 | $26,530 | $6,080 | $20,450 |
| 2019 | $2,491 | $28,010 | $6,120 | $21,890 |
| 2018 | $2,141 | $22,680 | $4,570 | $18,110 |
| 2017 | $2,108 | $29,390 | $5,050 | $24,340 |
| 2016 | $1,951 | $20,690 | $5,050 | $15,640 |
| 2015 | $1,884 | $14,720 | $5,050 | $9,670 |
| 2014 | $1,370 | $14,720 | $5,050 | $9,670 |
Source: Public Records
Map
Nearby Homes
- 870 Hemlock Way
- 1320 Holly Dr E
- 685 Daphne St
- 1148 Opal St Unit 101
- 1176 Opal St Unit 102
- 1150 Opal St Unit 101
- 400 W Midway Blvd
- 1190 Opal St Unit 104
- 1305 Laurel St
- 1330 Iris Cir
- 640 Kalmia Way
- 1320 W 12th Ave
- 1118 Oakhurst Dr
- 57 Scott Dr S
- 639 Quartz Way
- 1606 Iris St
- 2191 Ridge Dr
- 37 E 14th Place
- 114 E 14th Ct
- 51 Douglas Dr S
- 1020 Flint Way
- 1070 Hemlock Way
- 830 W 11th Ave
- 1080 Hemlock Way
- 1010 Flint Way
- 800 W 11th Ave
- 985 Garnet St
- 1030 Hemlock Way
- 1090 Hemlock Way
- 1085 Emerald St
- 1000 Flint Way
- 1055 Hemlock Way
- 1020 Hemlock Way
- 985 Flint Way
- 1065 Hemlock Way
- 975 Garnet St
- 1035 Hemlock Way
- 1075 Emerald St
- 1075 Hemlock Way
- 1025 Hemlock Way